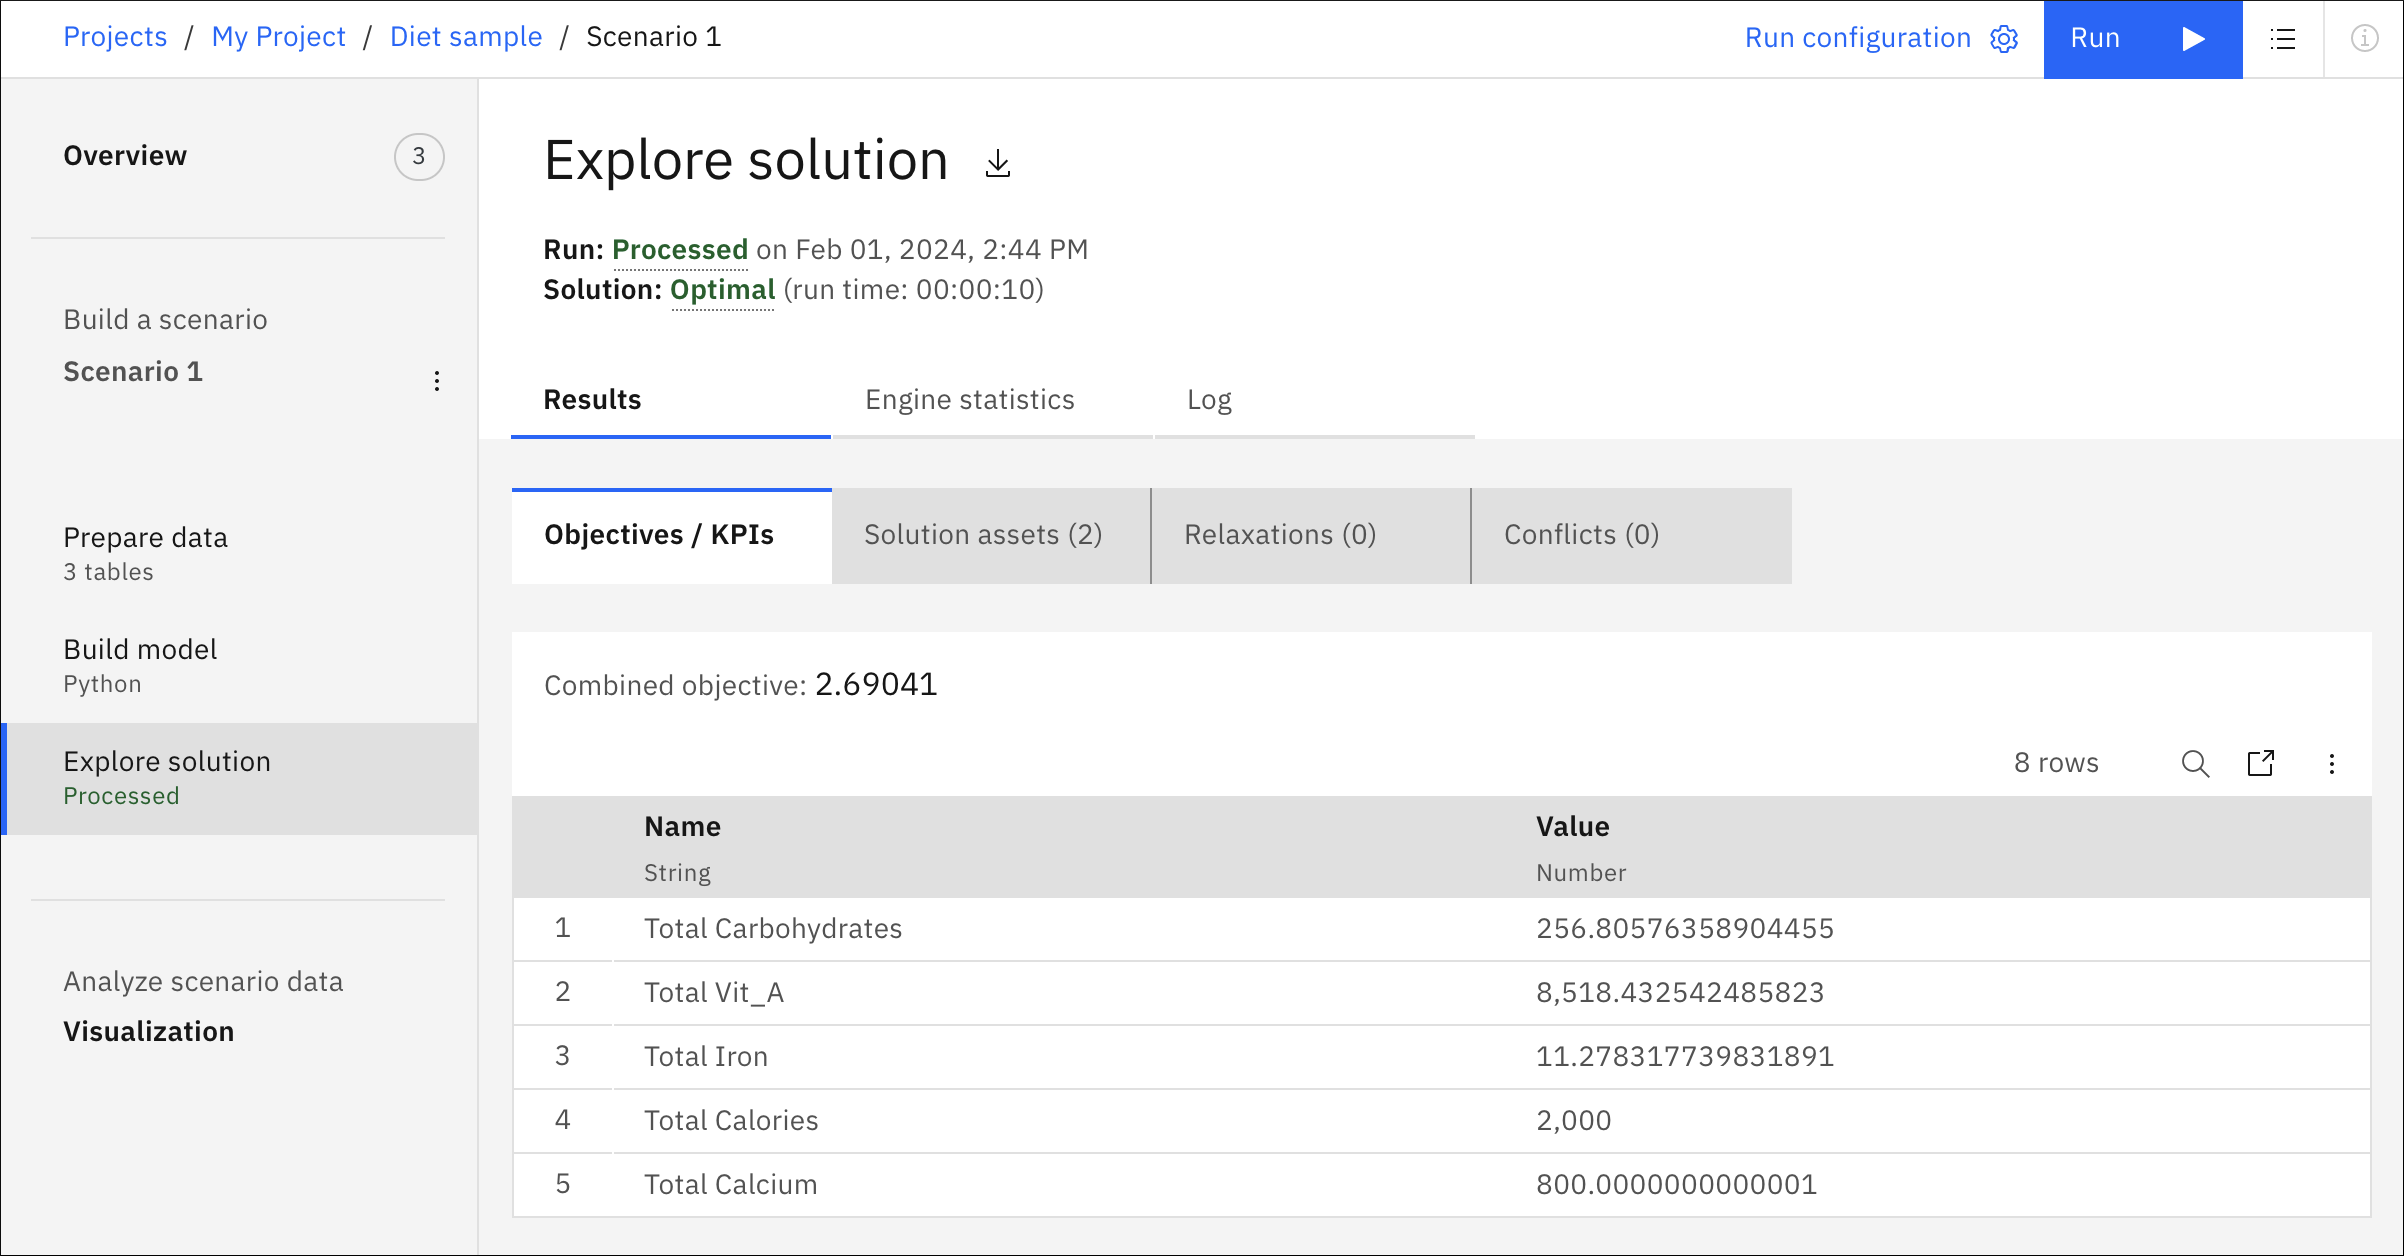
When your run completes successfully, the solution is displayed in one or several tables, or as a file for CPLEX and CPO models, in the Explore solution view.

The Results section contains several tabs. The first tab shows the Objectives and KPIs. The Solutions tables tab shows the resulting (best) values for the decision variables. These solution tables are automatically displayed in alphabetical order. The solution tables are not editable but can be filtered. For more information, see Table search and filtering in a Decision Optimization experiment. You can download both the objectives and solution tables, or export them to the project.
For CPLEX and CPO models, the solutions are not provided in tables, but in files that you can download.
You can define output tables to appear in this view in a Python DOcplex or OPL model . For more information, see Referencing imported data and defining solution output in a model.
The Relaxations and Conflicts tabs show if there are any conflicting constraints or bounds in the model. Also, if these options were chosen, these tabs show which constraints or bounds were relaxed in order to solve the model.
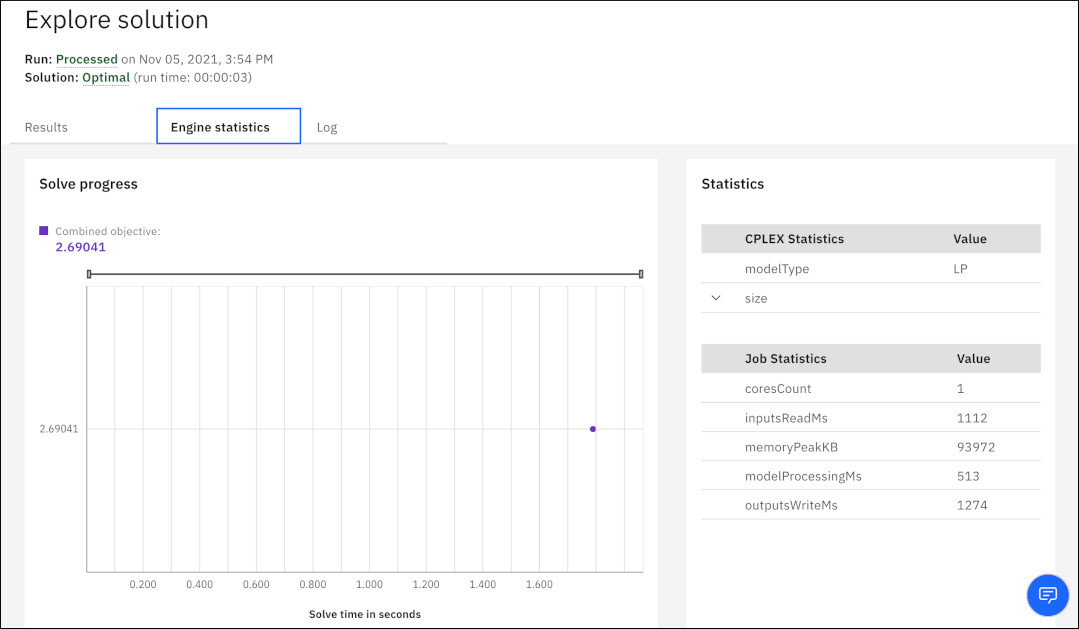
The Engine statistics tab shows you information about the run status (processed, stopped, or failed), graphical information about the solution, and model statistics. You can zoom-in on the graph by moving the end points of the horizontal zoom bar, or by selecting an area in the graph. To restore the original graph after zooming in, you can fully expand the zoom bar or refresh the page.

In the Results and Engine Statistics tabs you can also compare tables of different scenarios. Click the three dots next to the table, and select Compare with to choose a scenario. For more information, see Comparing scenario tables in a Decision Optimization experiment.
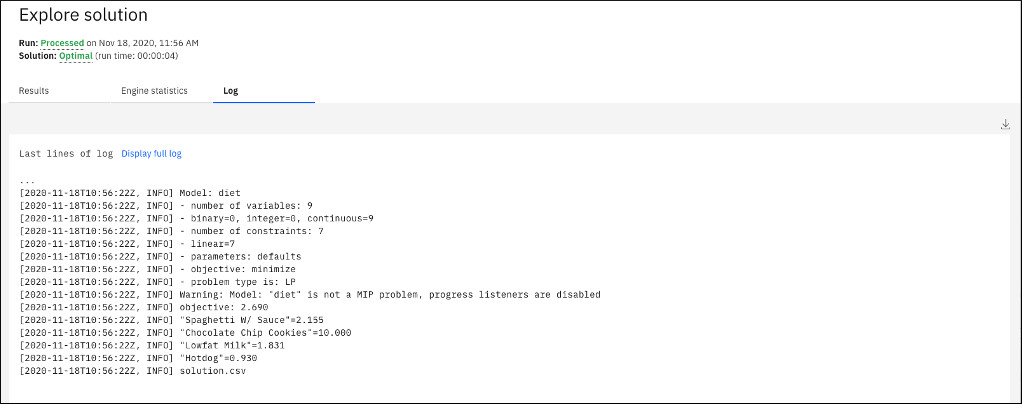
The Log tab displays the log file which you can also download.

For multi-objective models formulated with the Modeling Assistant, the solution table also displays the sliders, weights, and scale factors that are set in the model. The combined objective is the sum of all the objective values (positive additions for minimize objectives and negative for maximize objectives) multiplied by the scale factor (1 by default) and the weight factor. The weight factor is 2 to the power of the slider weight minus 1. For example, a slider weight of 5, the weight factor is 25-1= 24= 16. The scaled weighted value is thus the objective function value multiplied by this weight factor.
You can also create tables and charts for your solution. For more information, see Visualization view in a Decision Optimization experiment.