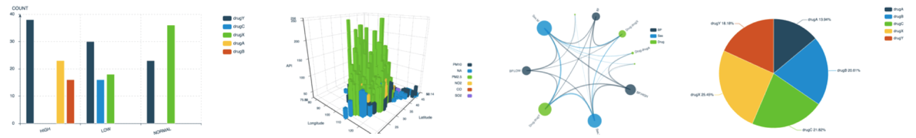
You can use a Charts node to start the chart builder. In the chart builder, you can use
advanced visualizations to explore your data from different perspectives and identify patterns,
connections, and relationships within your data.
You can also visualize your data with these same charts in a Data Refinery flow.Figure 1. Sample visualizations available for a flow