You can configure model health monitor evaluations to help you understand your model behavior and performance. You can use model health metrics to determine how efficiently your model deployment processes your transactions.
When model health evaluations are enabled, a model health data set is created in the data mart. The model health data set stores details about your scoring requests that are used to calculate model health metrics.
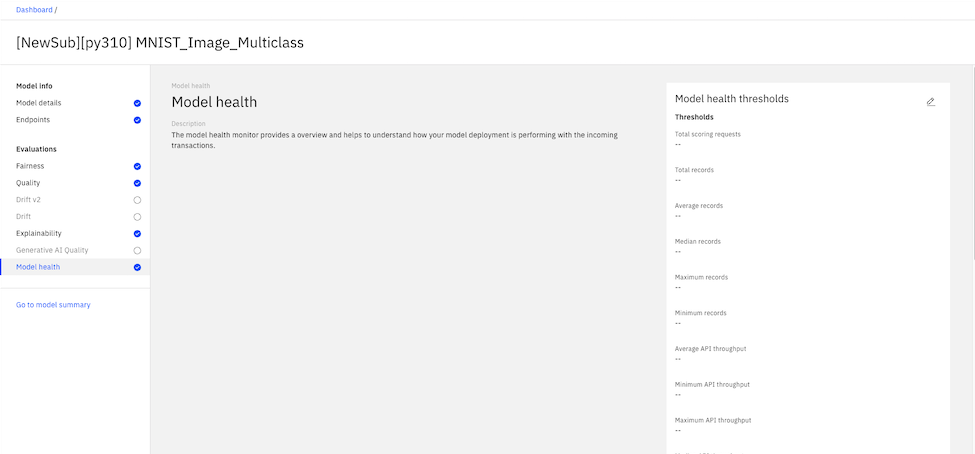
To configure model health monitor evaluations, you can set threshold values for each metric as shown in the following example:

Model health evaluations are not supported for pre-production deployments.
Supported model health metrics
The following metric categories for model health evaluations are supported. Each category contains metrics that provide details about your model performance:
Payload size
The total, average, minimum, maximum, and median payload size of the transaction records that your model deployment processes across scoring requests in kilobytes (KB) is calculated. Payload size metrics for image models are not supported.
Records
The total, average, minimum, maximum, and median number of transaction records that are processed across scoring requests is calculated during model health evaluations.
Scoring requests
The number of scoring requests that your model deployment receives during model health evaluations is calculated.
Throughput and latency
Latency is calculated by tracking the time that it takes to process scoring requests and transaction records per millisecond (ms). Throughput is calculated by tracking the number of scoring requests and transaction records that are processed per second.
To calculate throughput and latency, the response_time value from your scoring requests is used to track the time that your model deployment takes to process scoring requests.
For watsonx.ai Runtime deployments, the response_time value is automatically detected when you configure evaluations.
For external and custom deployments, you must specify the response_time value when you send scoring requests to calculate throughput and latency as shown in the following example from the Python SDK:
    from ibm_watson_openscale.supporting_classes.payload_record import PayloadRecord
        client.data_sets.store_records(
        data_set_id=payload_data_set_id,
        request_body=[
        PayloadRecord(
            scoring_id=<uuid>,
            request=openscale_input,
            response=openscale_output,
            response_time=<response_time>,
            user_id=<user_id>)
                    ]
        )
The following metrics are calculated to measure thoughput and latency during evaluations:
- API latency: Time taken (in ms) to process a scoring request by your model deployment.
- API throughput: Number of scoring requests processed by your model deployment per second
- Record latency: Time taken (in ms) to process a record by your model deployment
- Record throughput: Number of records processed by your model deployment per second
The average, maximum, median, and minimum throughput and latency for scoring requests and transaction records is calculated.
Users
The number of users that send scoring requests to your model deployments is calculated.
To calculate the number of users, the user_id from scoring requests is used to identify the users that send the scoring requests that your model receives.
For watsonx.ai Runtime deployments, the user_id value is automatically detected when you configure evaluations.
For external and custom deployments, you must specify the user_id value when you send scoring requests to calculate the number of users as shown in the following example from the Python SDK:
    from ibm_watson_openscale.supporting_classes.payload_record import PayloadRecord
        client.data_sets.store_records(
            data_set_id=payload_data_set_id,
            request_body=[
                PayloadRecord(
                    scoring_id=<uuid>,
                    request=openscale_input,
                    response=openscale_output,
                    response_time=<response_time>,
                    user_id=<user_id>). --> value to be supplied by user
            ]
        )
When you view the Users metric results, use the real-time view to see the total number of users and the aggregated views to see the average number of users. For more information, see Reviewing model health results.