You can analyze model transactions to understand how your model predicts outcomes. For example, you can review the predicted biased outcomes in payload transactions, or analyze a drop in accuracy, to get a better understanding of how your deployment is performing.
The following different methods are provided to help you analyze your model transactions:
Reviewing payload transactions
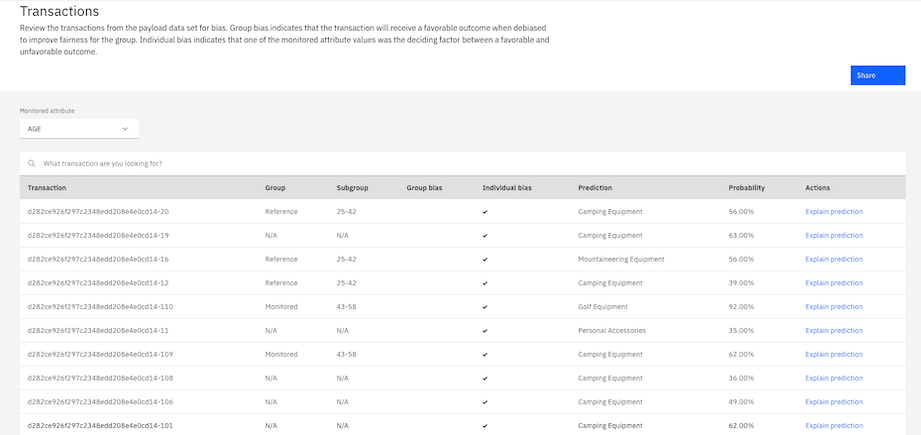
When you review results from fairness evaluations, you can select View payload transactions to view a list of all of the model transactions that are processed to predict any biased outcomes for each monitored attribute.

Reviewing drift transactions
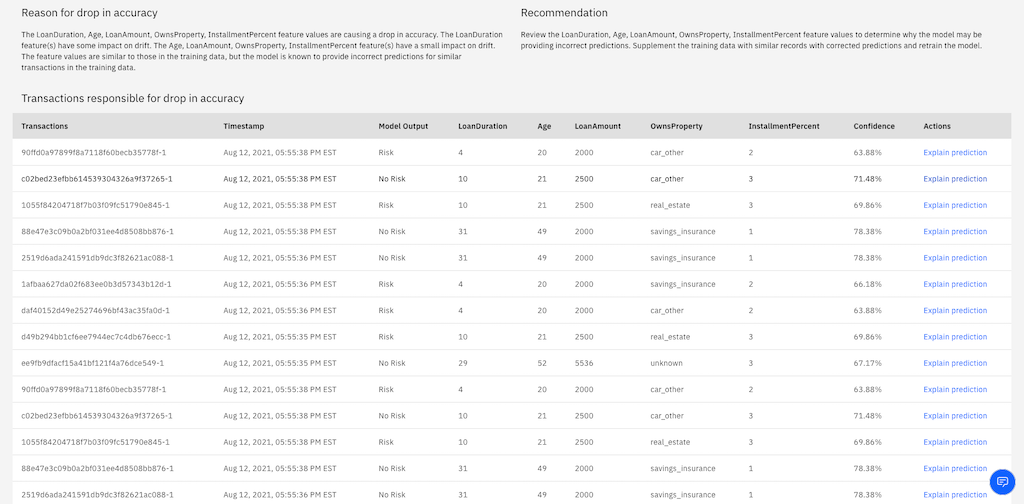
When you review results from drift evaluations, you can click the Number of transactions link on a transactions summary tile to view the transactions that are responsible for drift. The Transactions page specifies reasons for the drop in accuracy or drop in data consistency and provides a recommendation to help fix the drift of your model.

Reviewing performance
When you review evaluation results, you can review performance to understand how your model processes scoring requests. Performance evaluations are enabled by default when you add deployments. To evaluate performance, the total number of transaction records and the average number of transaction records per minute that your model processes is calculated.

Reviewing analytics
When you review evaluation results, you can use the Predictions by confidence chart to analyze the transactions that are sent to your deployment in the date range that you select by reviewing prediction classes and confidence distribution in each class. You can also use the Chart builder to create custom visualizations to help you better understand model predictions and inputs at run time.
The chart builder displays the output of the model’s prediction against the features or data ranges that you specify. For example, you can use the chart builder to see the split in predicted classes or confidence scores for different ranges of an attribute. You can also analyze the transactions that are sent to your deployment during a data range by creating a custom chart and choosing between featues, prediction classes, and confidence.

When you review any transactions on the Transactions page, you can choose to view explanations that provide details about how the predictions for each transaction are determined. For more information, see Explaining model transactions.
If your data includes a feature name containing a period (.), rendering a chart will fail with this error: Failed to get data
Learn more
Parent topic: Reviewing model insights