About cookies on this site Our websites require some cookies to function properly (required). In addition, other cookies may be used with your consent to analyze site usage, improve the user experience and for advertising. For more information, please review your options. By visiting our website, you agree to our processing of information as described in IBM’sprivacy statement. To provide a smooth navigation, your cookie preferences will be shared across the IBM web domains listed here.
Last updated: Nov 27, 2024
Evaluate an experiment for fairness to ensure that your results are not biased in favor of one group over another.
Limitations
Fairness evaluations are not supported for time series experiments.
Evaluating experiments and models for fairness
When you define an experiment and produce a machine learning model, you want to be sure that your results are reliable and unbiased. Bias in a machine learning model can result when the model learns the wrong lessons during training. This scenario can result when insufficient data or poor data collection or management results in a poor outcome when the model generates predictions. It is important to evaluate an experiment for signs of bias to remediate them when necessary and build confidence in the model results.
AutoAI includes the following tools, techniques, and features to help you evaluate and remediate an experiment for bias.
Definitions and terms
Fairness Attribute - Bias or Fairness is typically measured by using a fairness attribute such as gender, ethnicity, or age.
Monitored/Reference Group - Monitored group are those values of fairness attribute for which you want to measure bias. Values in the monitored group are compared to values in the reference group. For example, if Fairness Attribute=Gender
Favourable/Unfavourable outcome - An important concept in bias detection is that of favorable and unfavorable outcome of the model. For example, Claim approvedClaim denied
Disparate impact - The metric used to measure bias (computed as the ratio of percentage of favorable outcome for the monitored group to the percentage of favorable outcome for the reference group). Bias is said to exist if the disparate impact value is less than a specified threshold.
For example, if 80% of insurance claims that are made by males are approved but only 60% of claims that are made by females are approved, then the disparate impact is: 60/80 = 0.75. Typically, the threshold value for bias is 0.8. As this disparate impact ratio is less than 0.8, the model is considered to be biased.
Note when the disparate impact ratio is greater than 1.25 [inverse value (1/disparate impact) is under the threshold 0.8] it is also considered as biased.
Watch a video about evaluating and improving fairness
Watch this video to see how to evaluate a machine learning model for fairness to ensure that your results are not biased.
Video disclaimer: Some minor steps and graphical elements in this video might differ from your platform.
This video provides a visual method to learn the concepts and tasks in this documentation.
Applying fairness test for an AutoAI experiment in the UI
-
Open Experiment Settings.
-
Click the Fairness tab.
-
Enable options for fairness. The options are as follows:
- Fairness evaluation: Enable this option to check each pipeline for bias by calculating the disparate impact ration. This method tracks whether a pipeline shoes a tendency to provide a favorable (preferred) outcome for one group more often than another.
- Fairness threshold: Set a fairness threshold to determine whether bias exists in a pipeline based on the value of the disparate impact ration. The default is 80, which represents a disparate impact ratio less than 0.80.
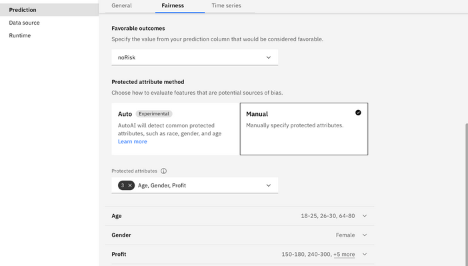
- Favorable outcomes: Specify the value from your prediction column that would be considered favorable. For example, the value might be "approved", "accepted" or whatever fits your prediction type.
- Automatic protected attribute method: Choose how to evaluate features that are a potential source of bias. You can specify automatic detection, in which case AutoAI detects commonly protected attributes, including: sex, ethnicity,
marital status, age, and zip or postal code. Within each category, AutoAI tries to determine a protected group. For example, for the
sexfemale
Note: In automatic mode, it is likely that a feature is not identified correctly as a protected attribute if it has untypical values, for example, being in a language other than English. Auto-detect is only supported for English.- Manual protected attribute method: Manually specify an outcome and supply the protected attribute by choosing from a list of attributes. Note when you manually supply attributes, you must then define a group and specify whether it is likely to have the expected outcomes (the reference group) or should be reviewed to detect variance from the expected outcomes (the monitored group).
For example, this image shows a set of manually specified attribute groups for monitoring.
Save the settings to apply and run the experiment to apply the fairness evaluation to your pipelines.
Notes:
- For multiclass models, you can select multiple values in the prediction column to classify as favorable or not.
- For regression models, you can specify a range of outcomes that are considered to be favorable or not.
- Fairness evaluations are not currently available for time series experiments.
List of automatically detected attributes for measuring fairness
When automatic detection is enabled, AutoAI will automatically detect the following attributes if they are present in the training data. The attributes must be in English.
- age
- citizen_status
- color
- disability
- ethnicity
- gender
- genetic_information
- handicap
- language
- marital
- political_belief
- pregnancy
- religion
- veteran_status
Applying fairness test for an AutoAI experiment in a notebook
You can perform fairness testing in an AutoAI experiment that is trained in a notebook and extend the capabilities beyond what is provided in the UI.
Bias detection example
In this example, by using the watsonx.ai Runtime Python API (ibm-watson-machine-learning), the optimizer configuration for bias detection is configured with the following input, where:
- name - experiment name
- prediction_type - type of the problem
- prediction_column - target column name
- fairness_info - bias detection configuration
fairness_info = {
"protected_attributes": [
{
"feature": "personal_status",
"reference_group": ["male div/sep", "male mar/wid", "male single"],
"monitored_group": ["female div/dep/mar"]
},
{
"feature": "age",
"reference_group": [[26, 100]],
"monitored_group": [[1, 25]]}
],
"favorable_labels": ["good"],
"unfavorable_labels": ["bad"],
}
from ibm_watson_machine_learning.experiment import AutoAI
experiment = AutoAI(wml_credentials, space_id=space_id)
pipeline_optimizer = experiment.optimizer(
name='Credit Risk Prediction and bias detection - AutoAI',
prediction_type=AutoAI.PredictionType.BINARY,
prediction_column='class',
scoring='accuracy',
fairness_info=fairness_info,
retrain_on_holdout=False
)
Evaluating results
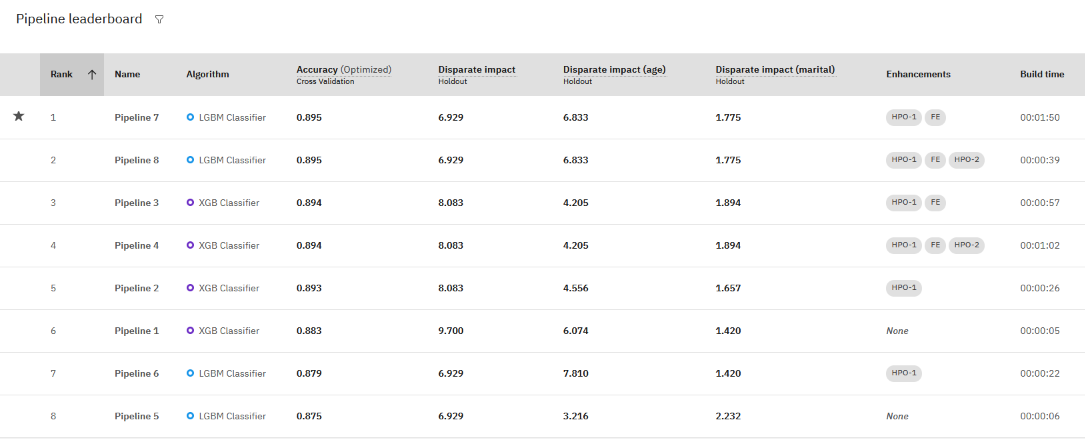
You can view the evaluation results for each pipeline.
- From the Experiment summary page, click the filter icon for the Pipeline leaderboard.
- Choose the Disparate impact metrics for your experiment. This option evaluates one general metric and one metric for each monitored group.
- Review the pipeline metrics for disparate impact to determine whether you have a problem with bias or just to determine which pipeline performs better for a fairness evaluation.
In this example, the pipeline that was ranked first for accuracy also has a disparate income score that is within the acceptable limits.
Bias mitigation
If bias is detected in an experiment, you can mitigate it by optimizing your experiment by using "combined scorers": accuracy_and_disparate_impactr2_and_disparate_impact
Combined scorers are used in the search and optimization process to return fair and accurate models.
For example, to optimize for bias detection for a classification experiment:
- Open Experiment Settings.
- On the Predictions page, choose to optimize Accuracy and disparate impact in the experiment.
- Rerun the experiment.
The Accuracy and disparate impact metric creates a combined score for accuracy and fairness for classification experiments. A higher score indicates better performance and fairness measures. If the disparate impact score is between 0.9 and 1.11 (an acceptable level), the accuracy score is returned. Otherwise, a disparate impact value lower than the accuracy score is returned, with a lower (negative) value which indicates a fairness gap.
Read this Medium blog post on Bias detection in AutoAI.
Next steps
Troubleshooting AutoAI experiments
Parent topic: AutoAI overview