This tutorial helps you analyze text by using nodes that specialize in handling text. For example, you can perform sentiment analysis.
In this tutorial, a hotel manager wants to analyze reviews for the hotel to see what customers think. The reviews express opinions about hotel personnel, comfort, cleanliness, price, and other areas of interest.
Try the tutorial
In this tutorial, you will complete these tasks:
Sample modeler flow and data set
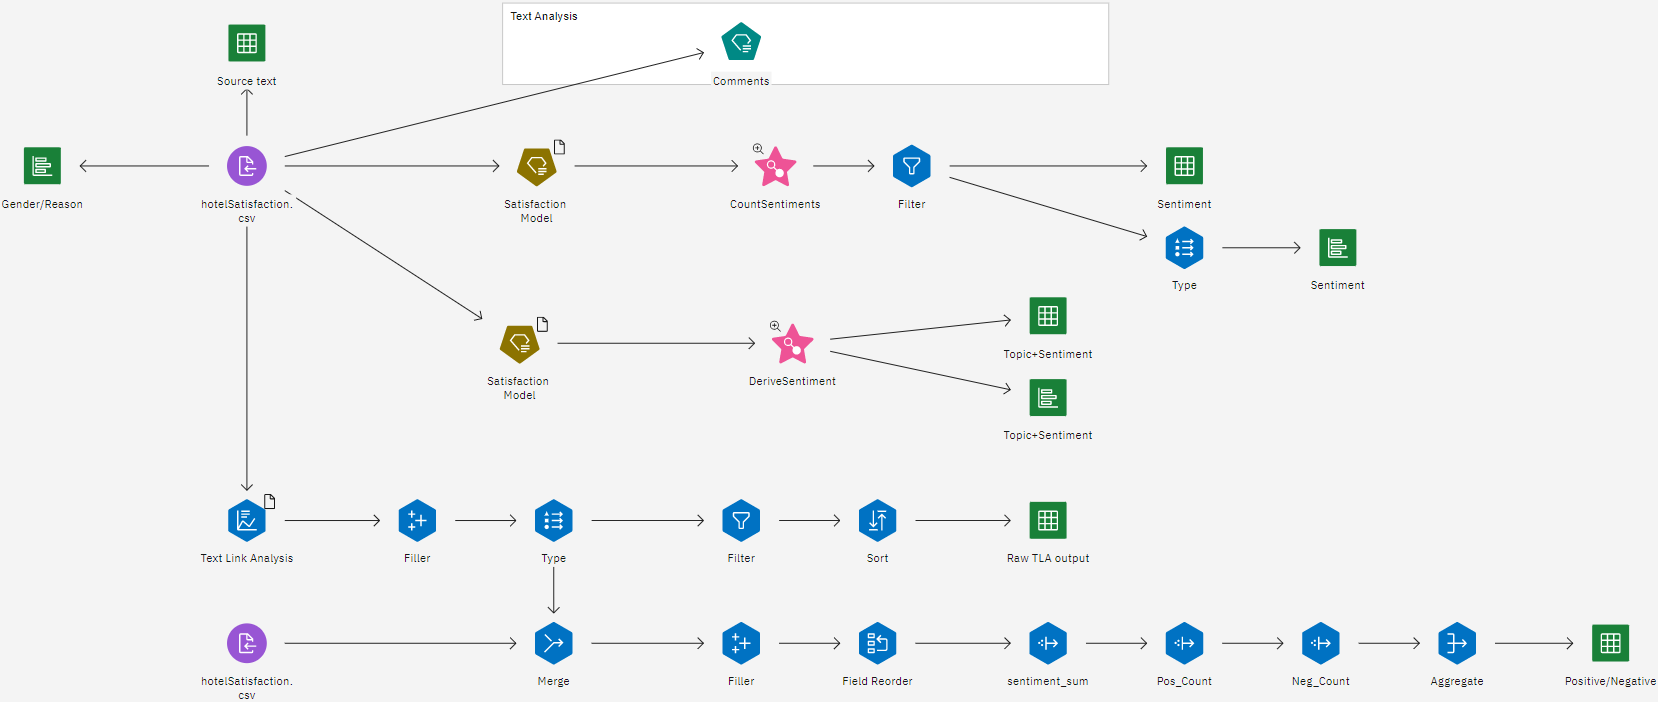
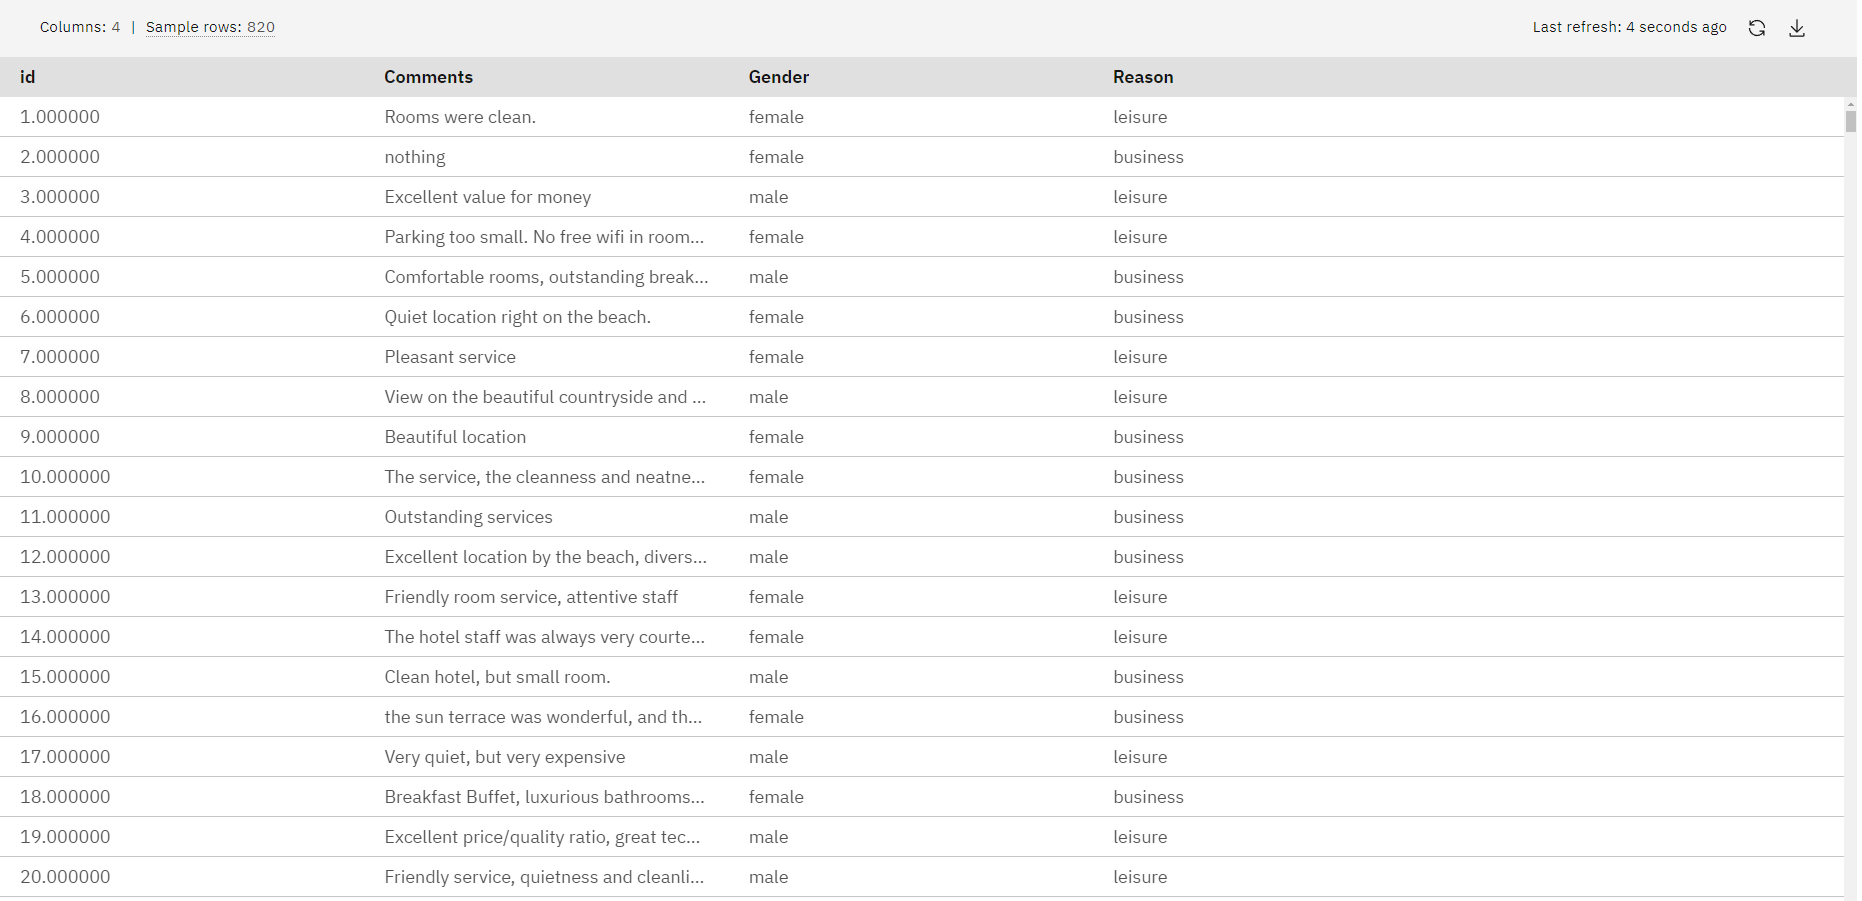
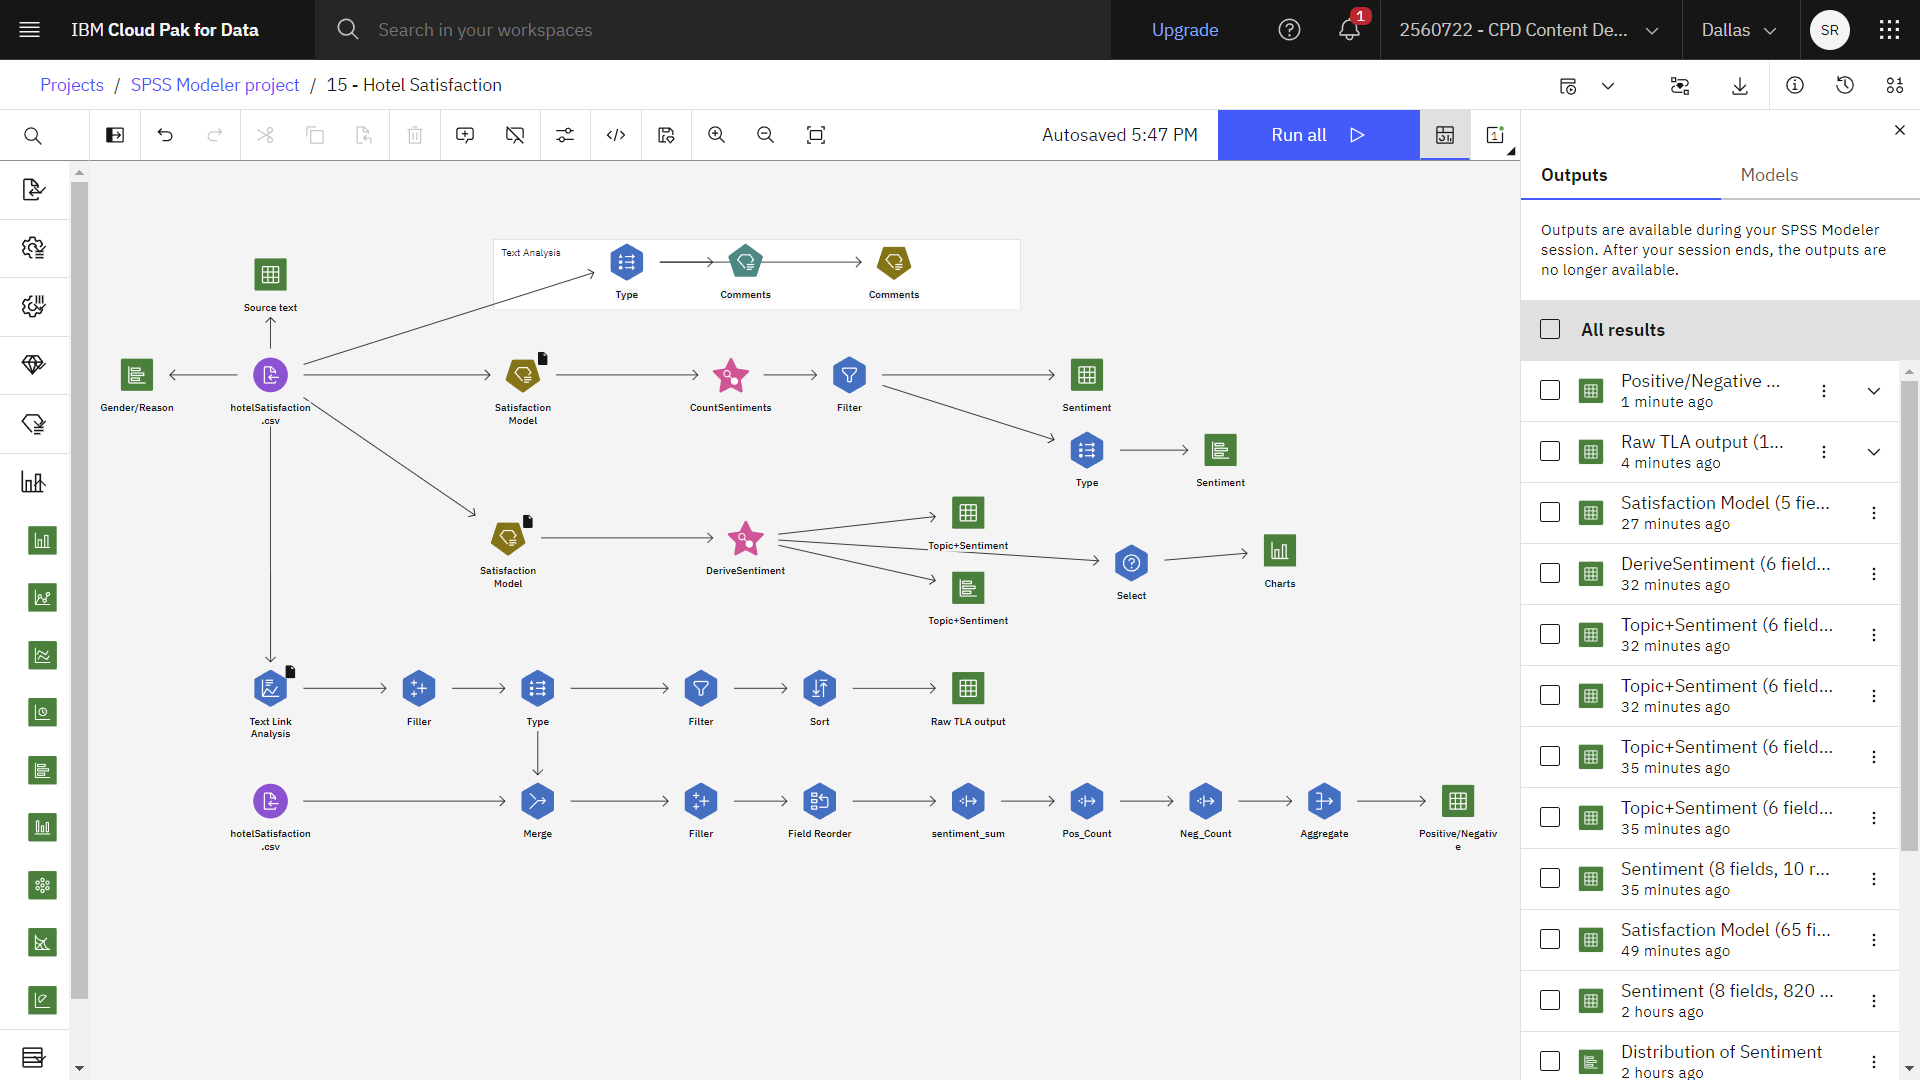
This tutorial uses the Hotel Satisfaction flow in the sample project. The flow uses Text Analytics nodes to analyze fictional reviews about the hotel. The data file used is hotelSatisfaction.csv. The following image shows the sample modeler flow.
Task 1: Open the sample project
The sample project contains several data sets and sample modeler flows. If you don't already have the sample project, then refer to the Tutorials topic to create the sample project. Then follow these steps to open the sample project:
- In watsonx, from the Navigation menu
, choose Projects > View all Projects.
- Click SPSS Modeler Project.
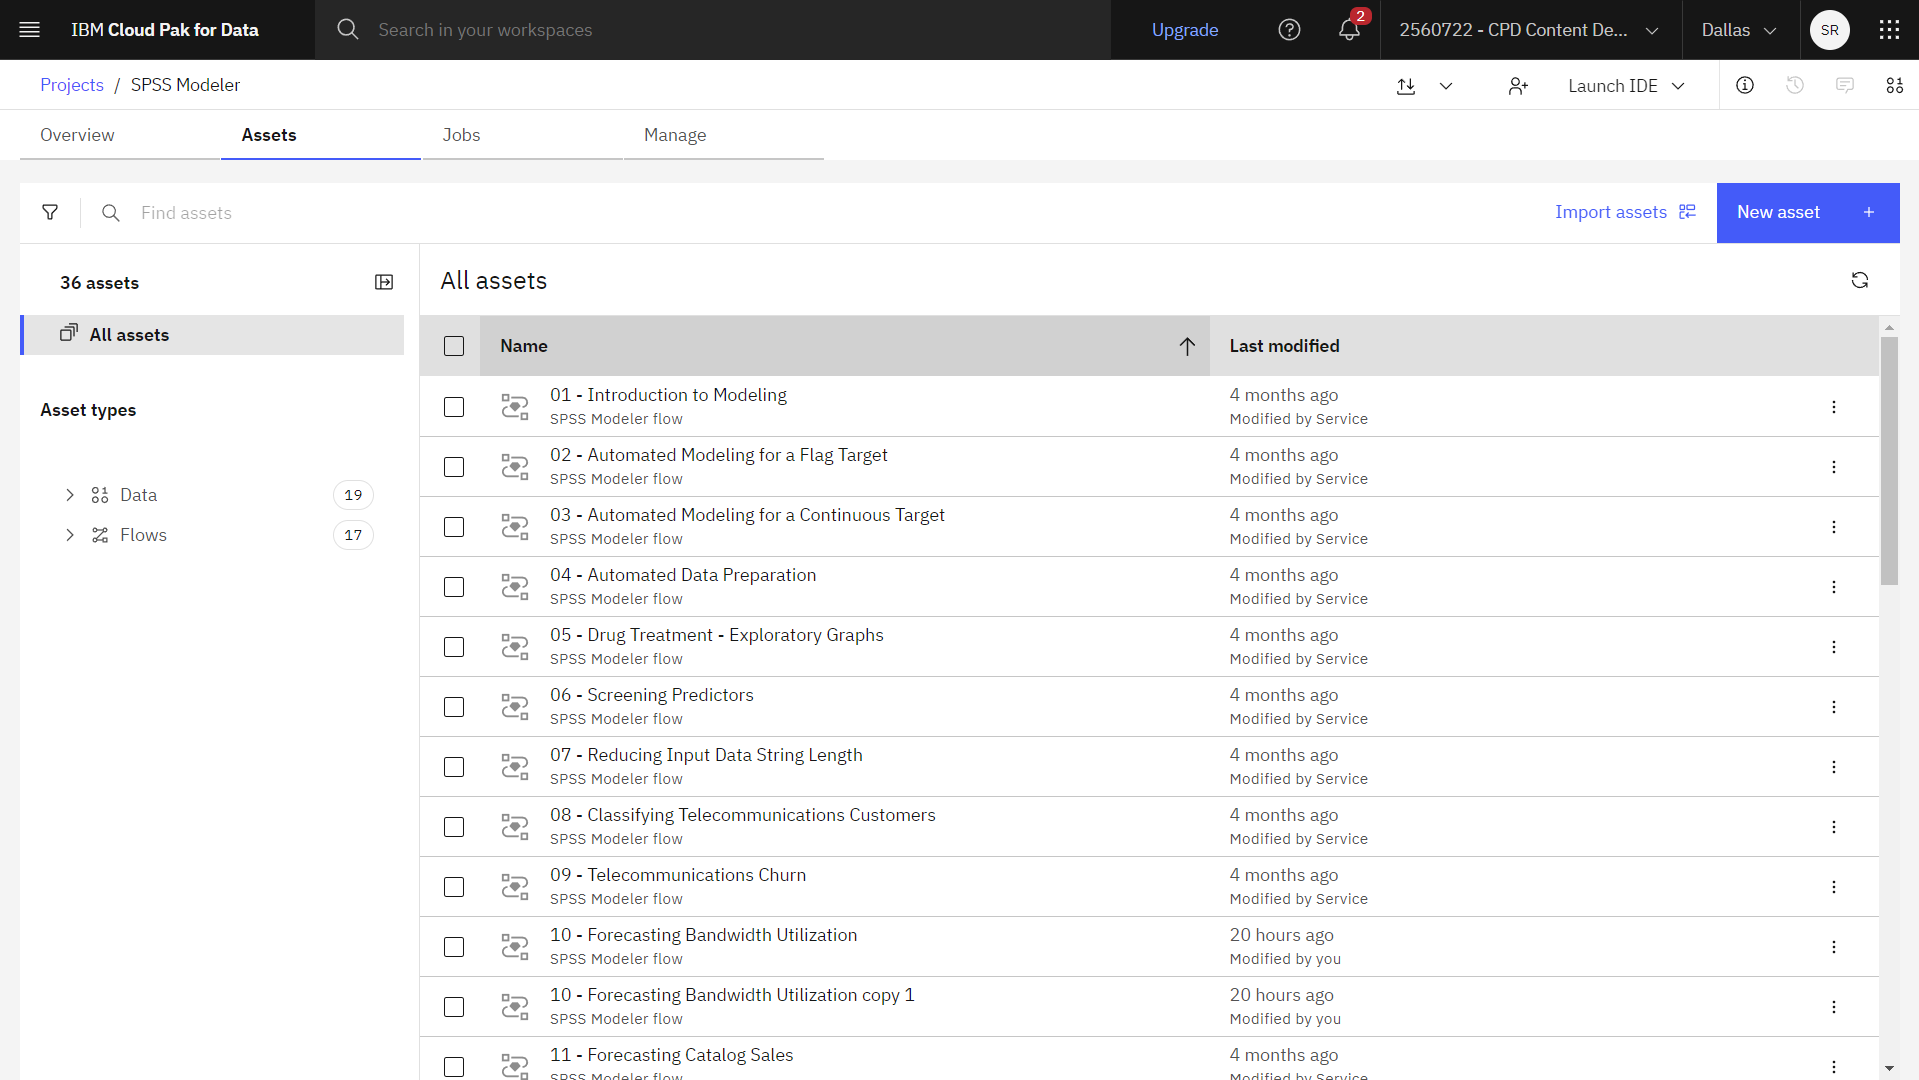
- Click the Assets tab to see the data sets and modeler flows.
Check your progress
The following image shows the project Assets tab. You are now ready to work with the sample modeler flow associated with this tutorial.
Task 2: Examine the Data Asset node
Hotel Satisfaction includes several nodes. Follow these steps to examine the Data Asset node:
- From the Assets tab, open the Hotel Satisfaction modeler flow, and wait for the canvas to load.
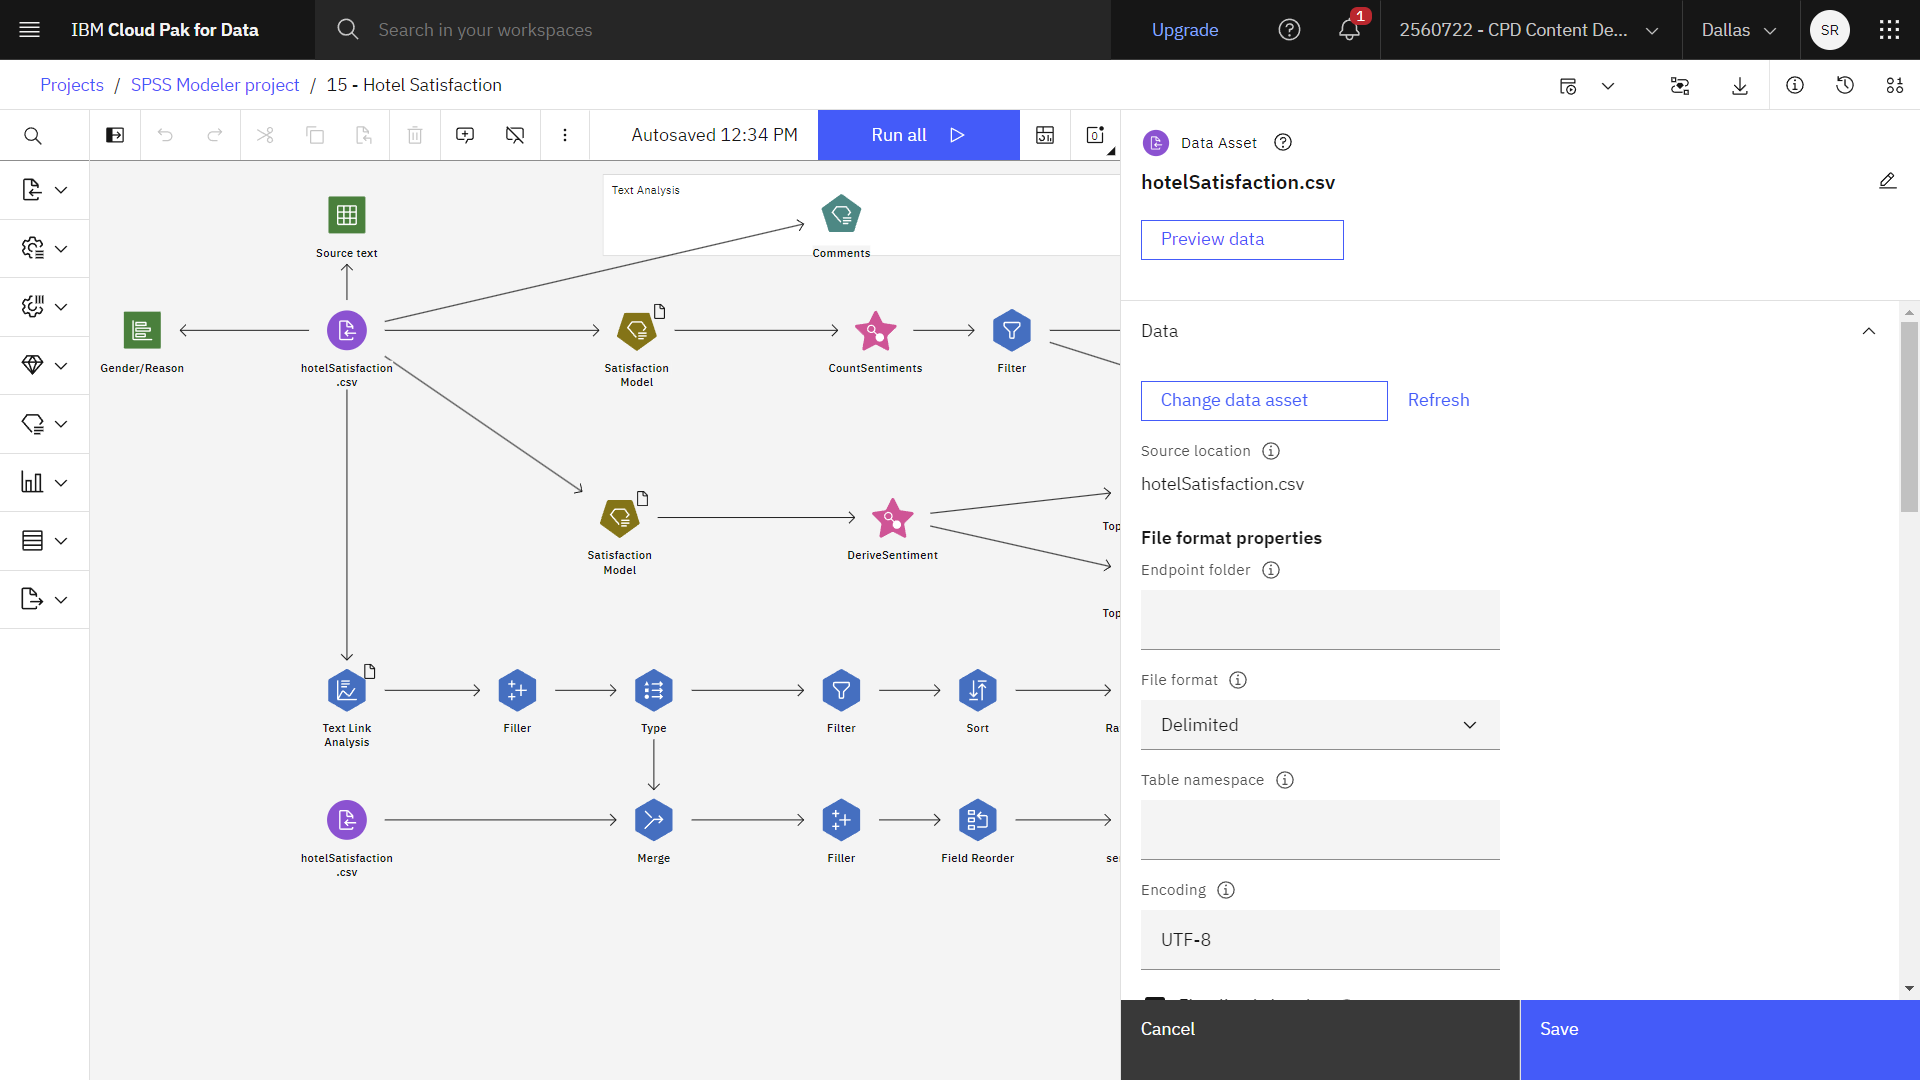
- Double-click the hotelSatisfaction.csv node. This node is a Data Asset node that points to the hotelSatisfaction.csv file in the project.
- Review the File format properties.
- Optional: Click Preview data to see the full data set.
Check your progress
The following image shows the Data Asset node. You are now ready to examine the Text Mining node.
Task 3: Examine the Text Mining node
Text mining is an iterative process that identifies relevant concepts and patterns in the text data. When you run the Text Mining node, the extraction engine reads through the text data, identifies the relevant concepts, and assigns a type to each. You can then review the extraction results by using the Text Analytics Workbench to fine-tune the extraction process. You can rerun the Text Mining node to produce new results, and then evaluate the new results. Note the Type node in between the Data Asset node and the Text Mining node. The Type node is required to correctly identify the fields in the data set. Follow these steps to examine the Text mining node:
- Double-click the Comments (Text Mining) node to see its properties.
- Set these properties in the Fields section:
- For the Text field, select Comments.
- For the ID field, select id.Note: Only the Text field is required.
Figure 3. Text Mining node properties 
- In the Model section, notice that the selected Text analysis package is Hotel
Satisfaction (English)/Topic + Opinion.
A text analysis package (TAP) is a predefined set of libraries and advanced linguistic and nonlinguistic resources, which are bundled with one or more sets of predefined categories. If no text analysis package is relevant for your application, you can instead select a Resource template instead. A resource template is a predefined set of libraries and advanced linguistic and nonlinguistic resources that were fine-tuned for a particular domain or usage.
- In the Build models section, set these properties:
- Verify that the Build modes field is set to Build interactively (category model nugget). Later when you run the node, this option starts Text Analytics Workbench, which is an interactive interface where you can explore and fine-tune the extraction results.
- Verify that the Begin session by field is set to Extracting concepts and text links. The Extracting concepts option extracts only concepts, whereas TLA extraction outputs both concepts and text links that are connections between topics (such as service, personnel, and food) and opinions.
- Expand the Expert section, and verify that the Accommodate
spelling for a minimum word character length of option is selected with a Spelling
limit of
5. This option applies a fuzzy grouping technique that helps group commonly misspelled words or closely spelled words under one concept. The fuzzy grouping algorithm temporarily strips double or triple consonants and all vowels (except the first one) from extracted words. It then compares them to see whether they're the same. For example,locationandlocattoinare grouped.Figure 4. Text Mining node expert properties. 
- Click Save.
- Hover over the Comments (Text Mining) node, and click the Run icon
.
- In the Outputs and models pane, click the results with the name Comments to open the Text Analytics Workbench.
Check your progress
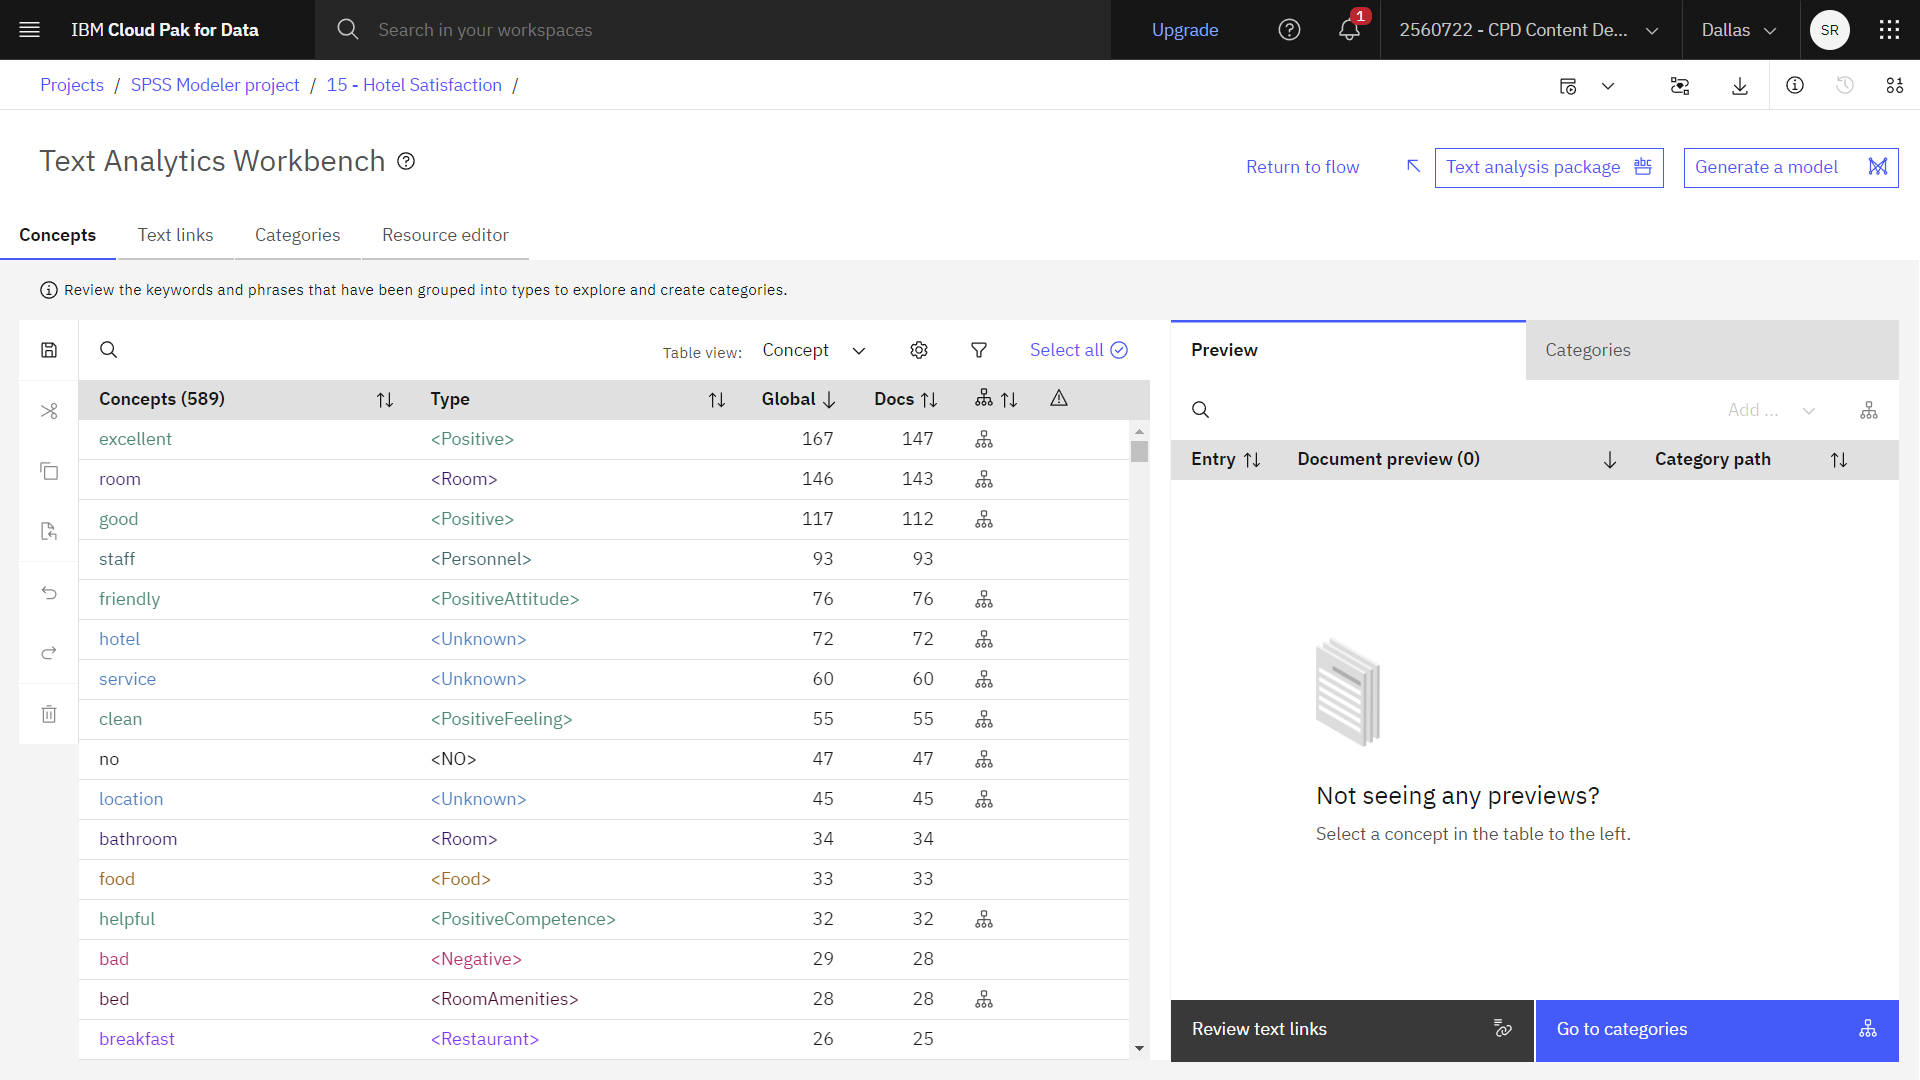
The following image shows the Text Analytics Workbench. You are now ready to tune the results.
Task 4: Tune the results in the Text Analytics Workbench
The Text Analytics Workbench contains the extraction results and the category model that is contained in the text analytics package. It is an interactive workbench where you can explore and fine-tune the extracted results, build and refine categories, and build category model nuggets. Follow these steps to tune the results in the Text Analytics Workbench:
Concepts
- Click the Concepts tab.
During the extraction process, the text data is analyzed to identify interesting or relevant single words such as
airportorlocation, and word phrases such asairport pick-up. These words and phrases are collectively referred to as terms. Using the linguistic resources, the relevant terms are extracted, and similar terms are grouped under a lead term that is called a concept.In this way, a concept might represent multiple underlying terms. It depends on how the term is used in your text and the set of linguistic resources you're using.
- Click the Filter icon
- You can also use a Filter to select a subset of concepts. The following
image shows the different options:
Figure 5. Text Analytics Workbench - filter options 
If you want to remove the filters and display all concepts, click Clear Filter.
Click Cancel to close the Filter pane.
Text links
- Click the Text links tab.
Text link analysis (TLA) is a pattern-matching technology that compares TLA rules to extracted concepts and relationships that are found in your text. On the Text links tab, you can build and explore the TLA patterns that are found in your text data.
- Select a Type Pattern (for example, <Services> + <Positive> to see a preview
of the text in the document. If the text in the Document preview is truncated, click the
View entire document icon
to display the entire text.

Categories
- Click the Categories tab.
You can build and manage your categories. After the concepts and types are extracted from your text data, you can begin building categories automatically by using techniques such as concept inclusion, semantic network (in English only), or manually.
Since this example flow uses a text analysis package template, the category model is already populated.
- Click Score all to score the documents or records. Each time a category is created or updated, you can see whether any text matches a descriptor in a specific category. If a match is found, the document or record is assigned to that category. The result is that most, if not all, of the documents or records are assigned to categories based on the descriptors in the categories.
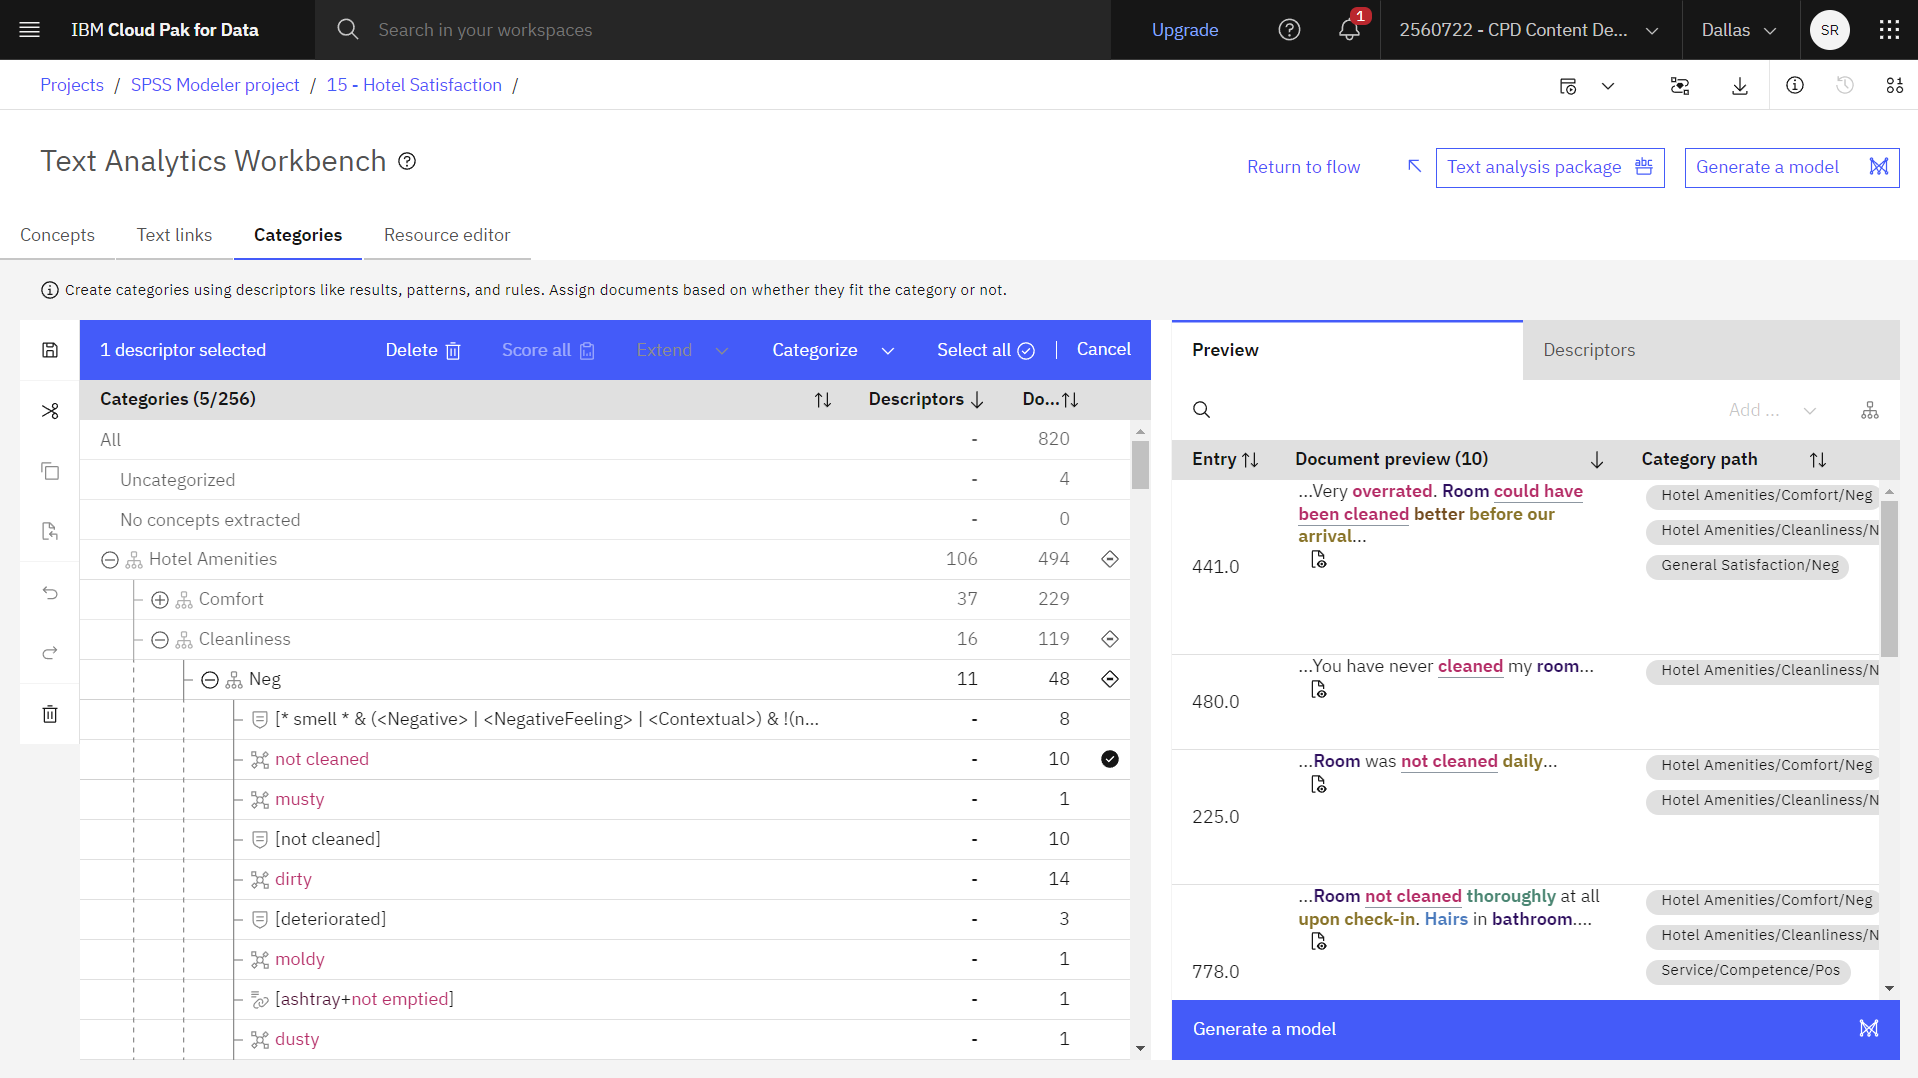
- Expand a category, for example, Hotel Amenities > Cleanliness > Neg > not cleaned.
- View the documents on the Preview tab and the Descriptors tab to see the source data.
Check your progress
The following image shows the document preview for the Cleanliness category. You are now ready to build the model.
Task 5: Build the model
Once you finish tuning the extraction process, you can generate a category model from the customizations and the categories that you built. Follow these steps to build and deploy the model:
- Click Generate a model to generate a category model.

- Click Build to confirm that you want to generate a category model.
- When you see the Success! message click Return to flow.
- Click Save and exit to save your changes and Text Mining node in
the flow.The generated category model nugget is displayed on your flow canvas.
Figure 6. Generated category model nugget 
- Notice the two Satisfaction Model nodes in the example flow. Now that the Text Analytics
Workbench validated and generated a category model, you can deploy it in your flow and score the
same data set or score new data. Each model uses a different mode for scoring.
Figure 7. Example flow with two modes for scoring 
- Double-click the first Satisfaction Model node.
- Expand the Settings section to see that this node uses the Categories as fields scoring mode. With this scoring mode, there are just as many output records as there were in the input.
- Click Preview data. You can see that each record now contains one new field for every
category that was selected on the Model tab. For each field, enter a flag
value for true and for false, such as
True/False, or1/0. In this flow, values are set to1and0to aggregate results and count the number of positive, negative, mixed (both positive and negative), or no score (no opinion) answers.Figure 8. Model results - categories as fields (1). 
- Close the Preview window.
- Click Cancel.
- Double-click the second Satisfaction Model node.
- Expand the Settings section to see that this node uses the Categories as
records scoring mode. A new record is created for each
category,
document
pair. Typically, there are more records in the output than there were in the input. - Click Preview data. You can see that, along with the input fields, new fields are also
added to the data depending on what kind of model it is.
Figure 9. Model results - categories as records (2). 
- Close the Preview window.
- Click Cancel.
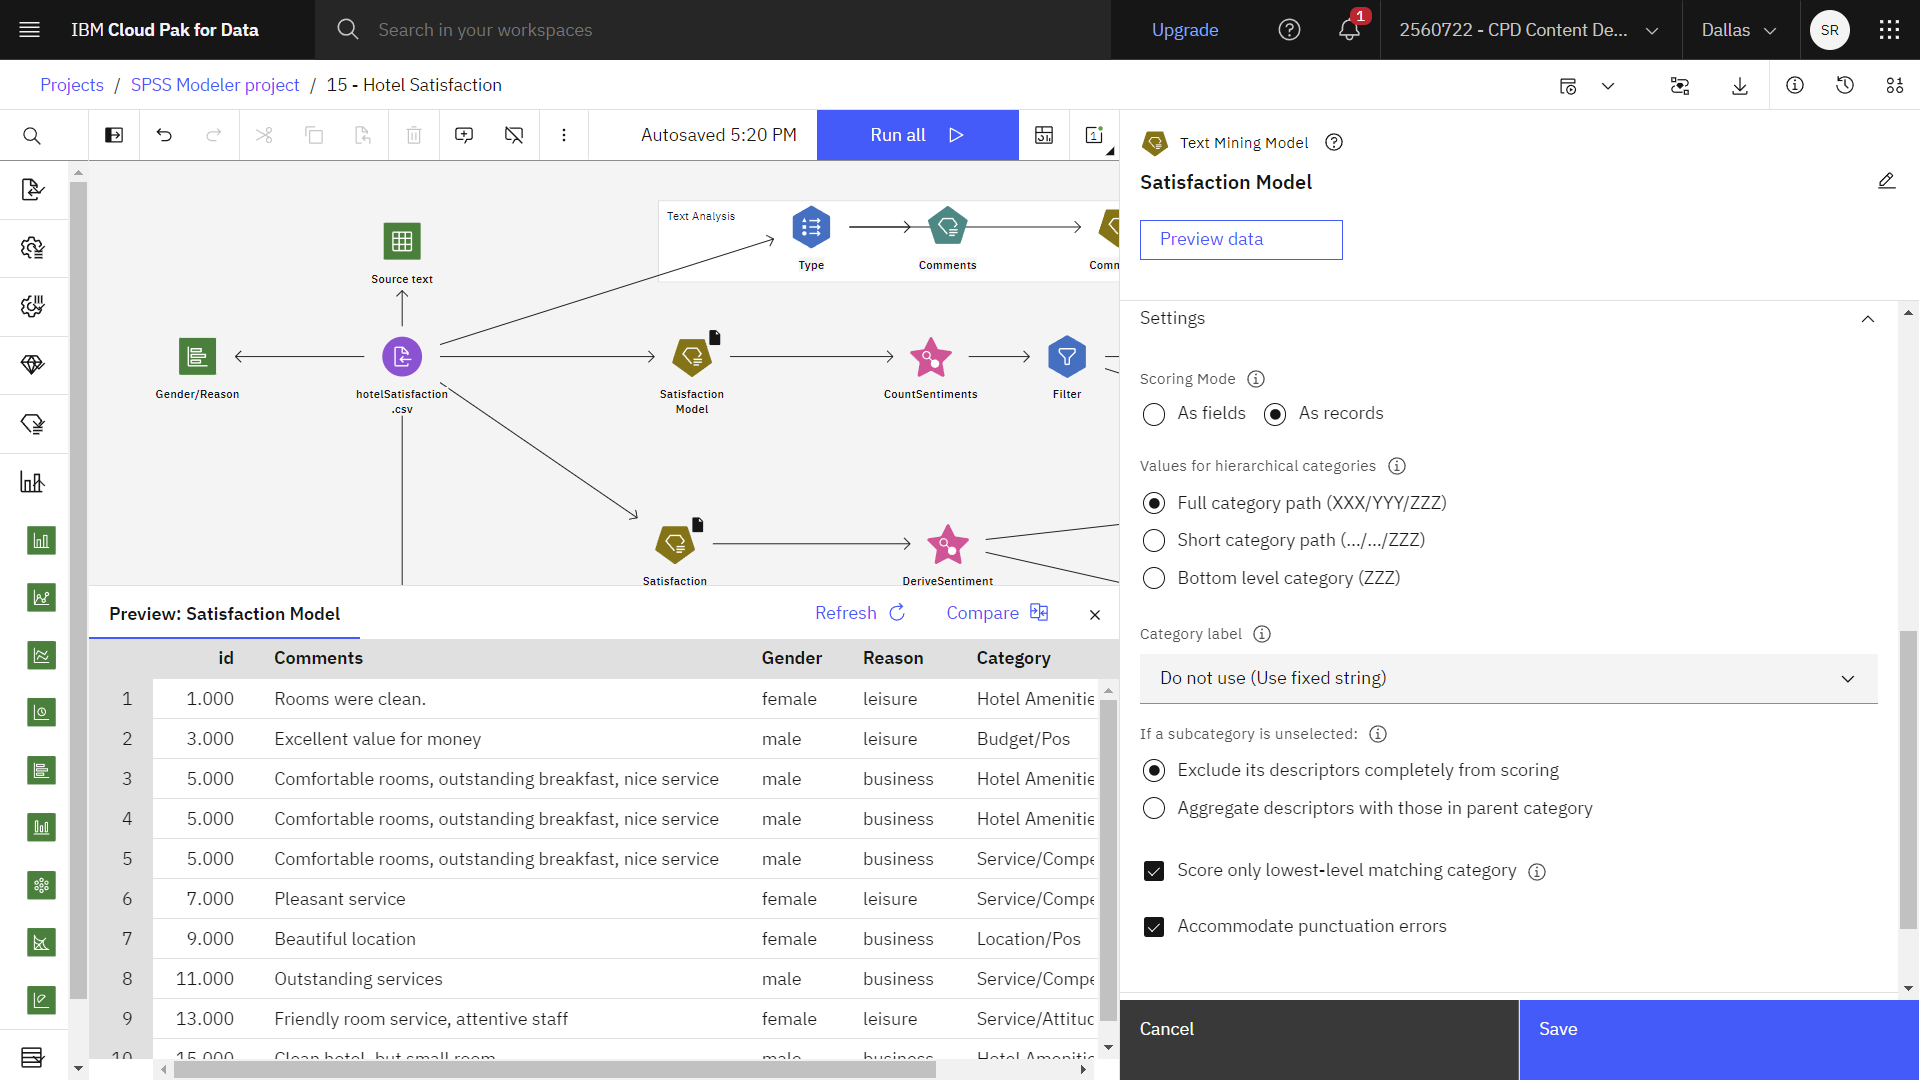
- Expand the Settings section to see that this node uses the Categories as
records scoring mode. A new record is created for each
Check your progress
The following image shows the satisfaction model with a document preview. You are now ready to visualize the comments.
Task 6: Visualize the comments
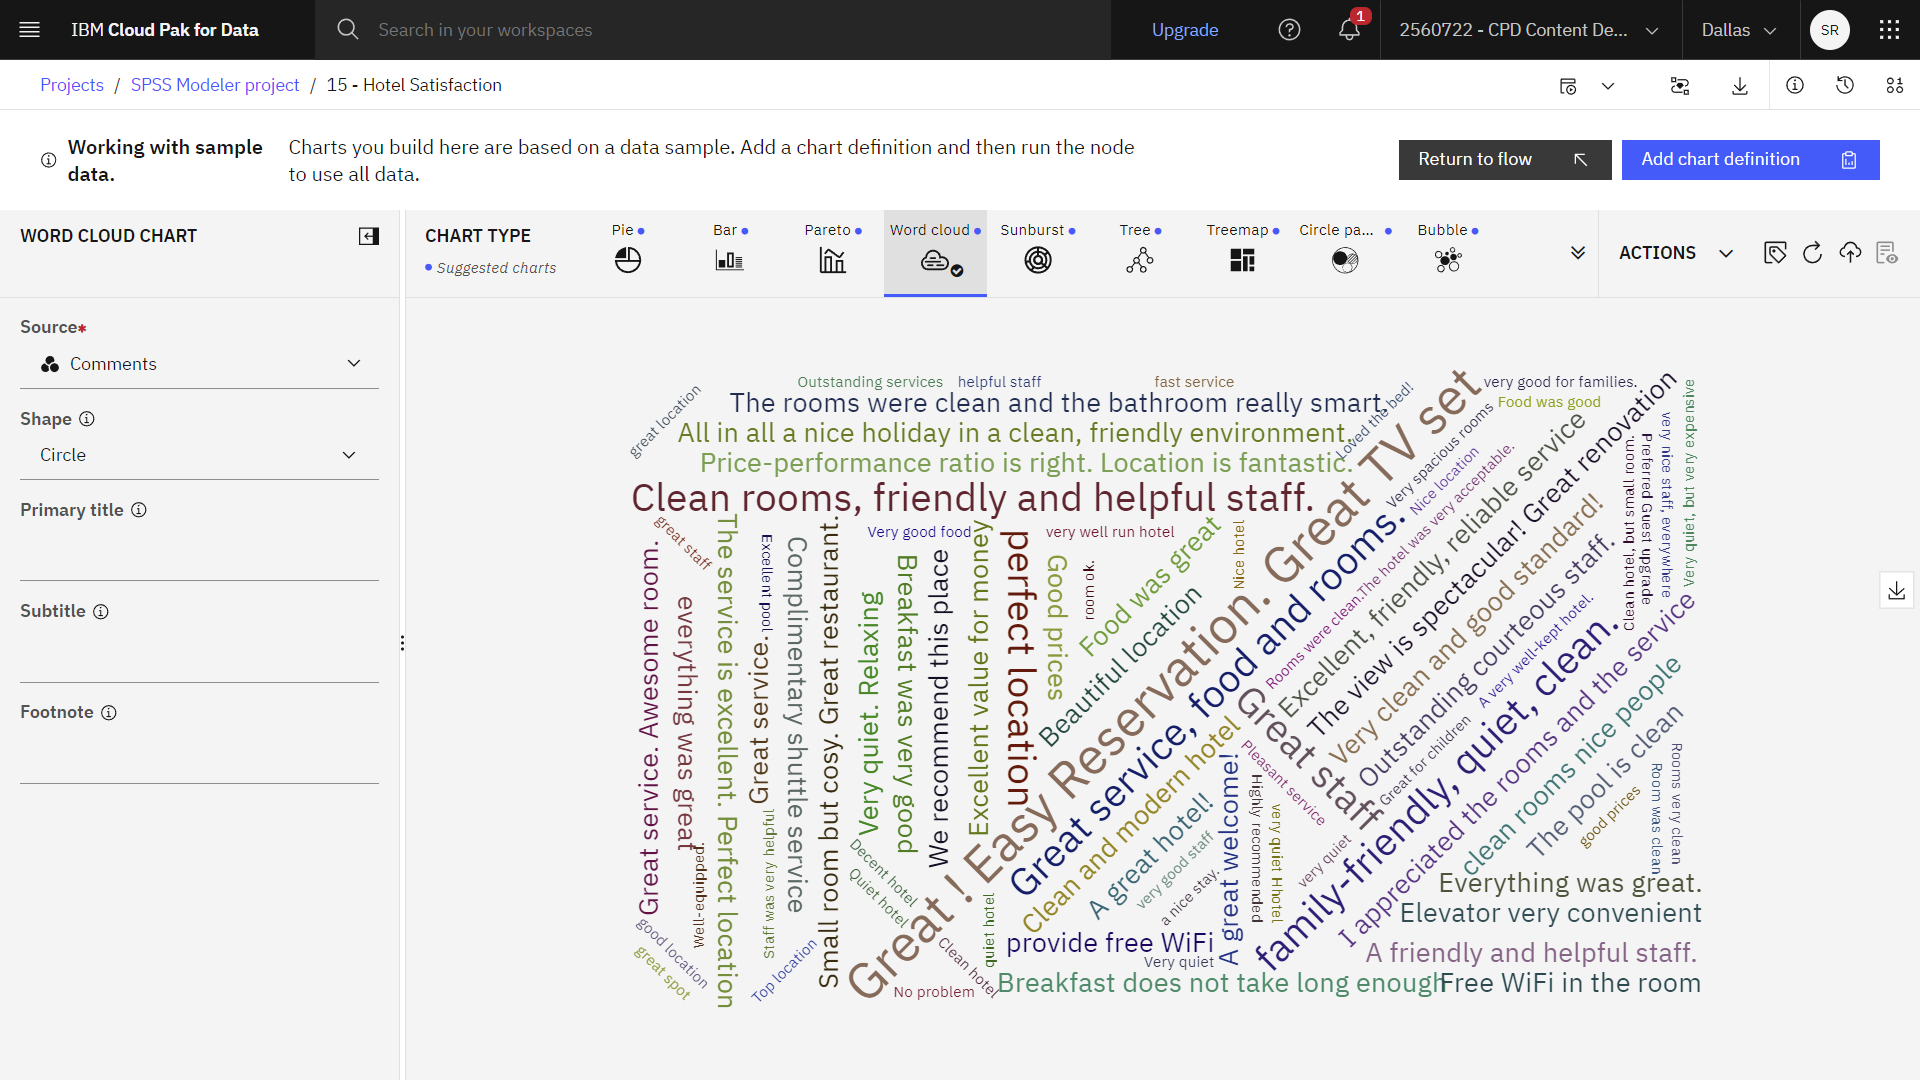
You can gain quick insights about what guests appreciate about the hotel by visualizing the comments. Follow these steps to create a word cloud chart:
- Select the positive comments:
- In the palette, expand the Record Operations section.
- Drag the Select node onto the canvas.
- Connect the Derive Sentiment supernode to the Select node.
- Double-click the Select node to view its properties.
- For the Mode, select Include.
- For the Condition, type
Sentiment = "Pos". - Click Save.
- Add a chart:
- In the palette, expand the Graphs section.
- Drag the Charts node onto the canvas.
- Connect the Select node to the Charts node.
- Build a word cloud chart:
- Double-click the Charts node to view its properties.
- Click Launch Chart Builder.
- For the Columns to visualize, select Comments.
- Display the list of all chart types, and select Word cloud.
Figure 10. All chart types 
- When you done, click Return to flow.
Check your progress
The following image shows a word cloud chart. You are now ready to examine the Text Link Analysis node.
Task 7: Examine the Text Link Analysis node

- Double-click the Text Link Analysis node to see its properties.
- Set these properties in the Fields section:
- For the Text field, select Comments.
- For the ID field, select id.Note: Only the Text field is required.
Figure 11. Text Link Analysis node FIELD properties. 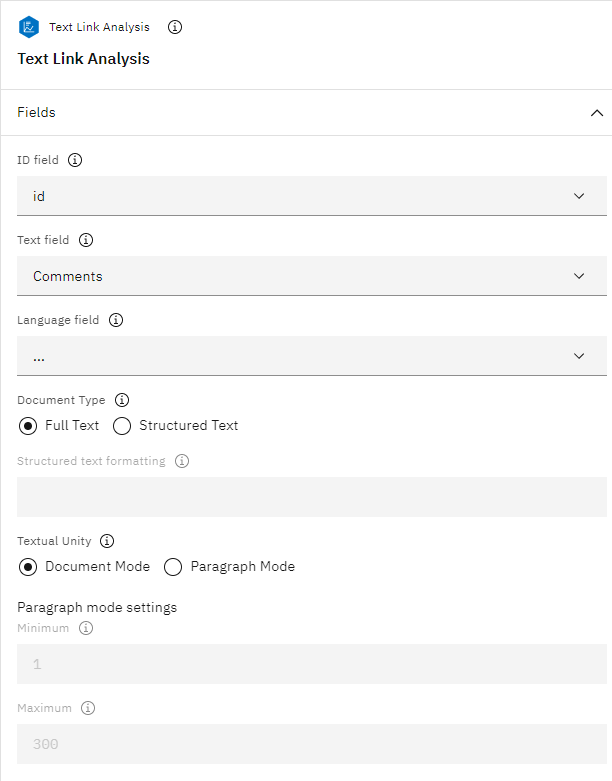
- In the Copy resources from section, notice that the selected Resource template is
Hotel Satisfaction (English).
A resource template is a predefined set of libraries and advanced linguistic and nonlinguistic resources that were fine-tuned for a particular domain or usage.
- Expand the Expert section, and verify that the Accommodate
spelling for a minimum word character length of option is selected with a Spelling
limit of
5.Figure 12. Text Link Analysis node Expert properties. 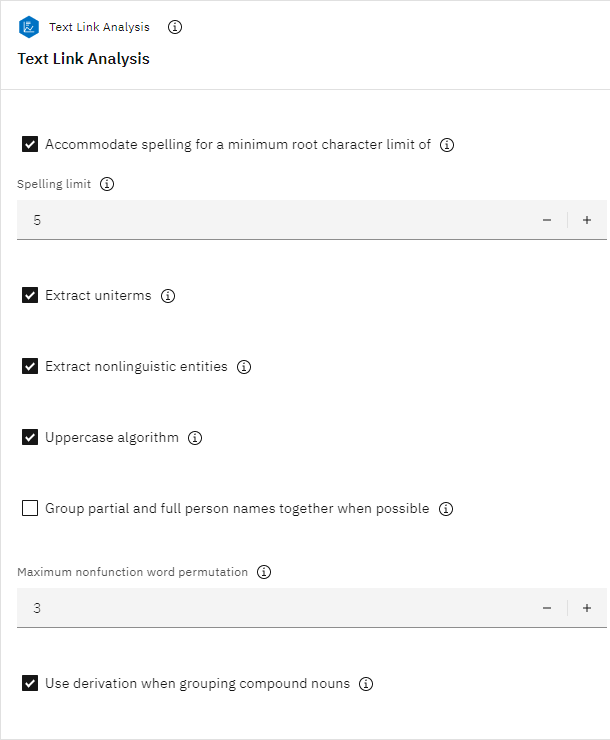
- Click Save.
- Hover over the Raw TLA output node, and click the Run icon
.
- In the Outputs and models pane, click the results with the name Raw TLA output to
see the results.
Figure 13. Raw TLA output. 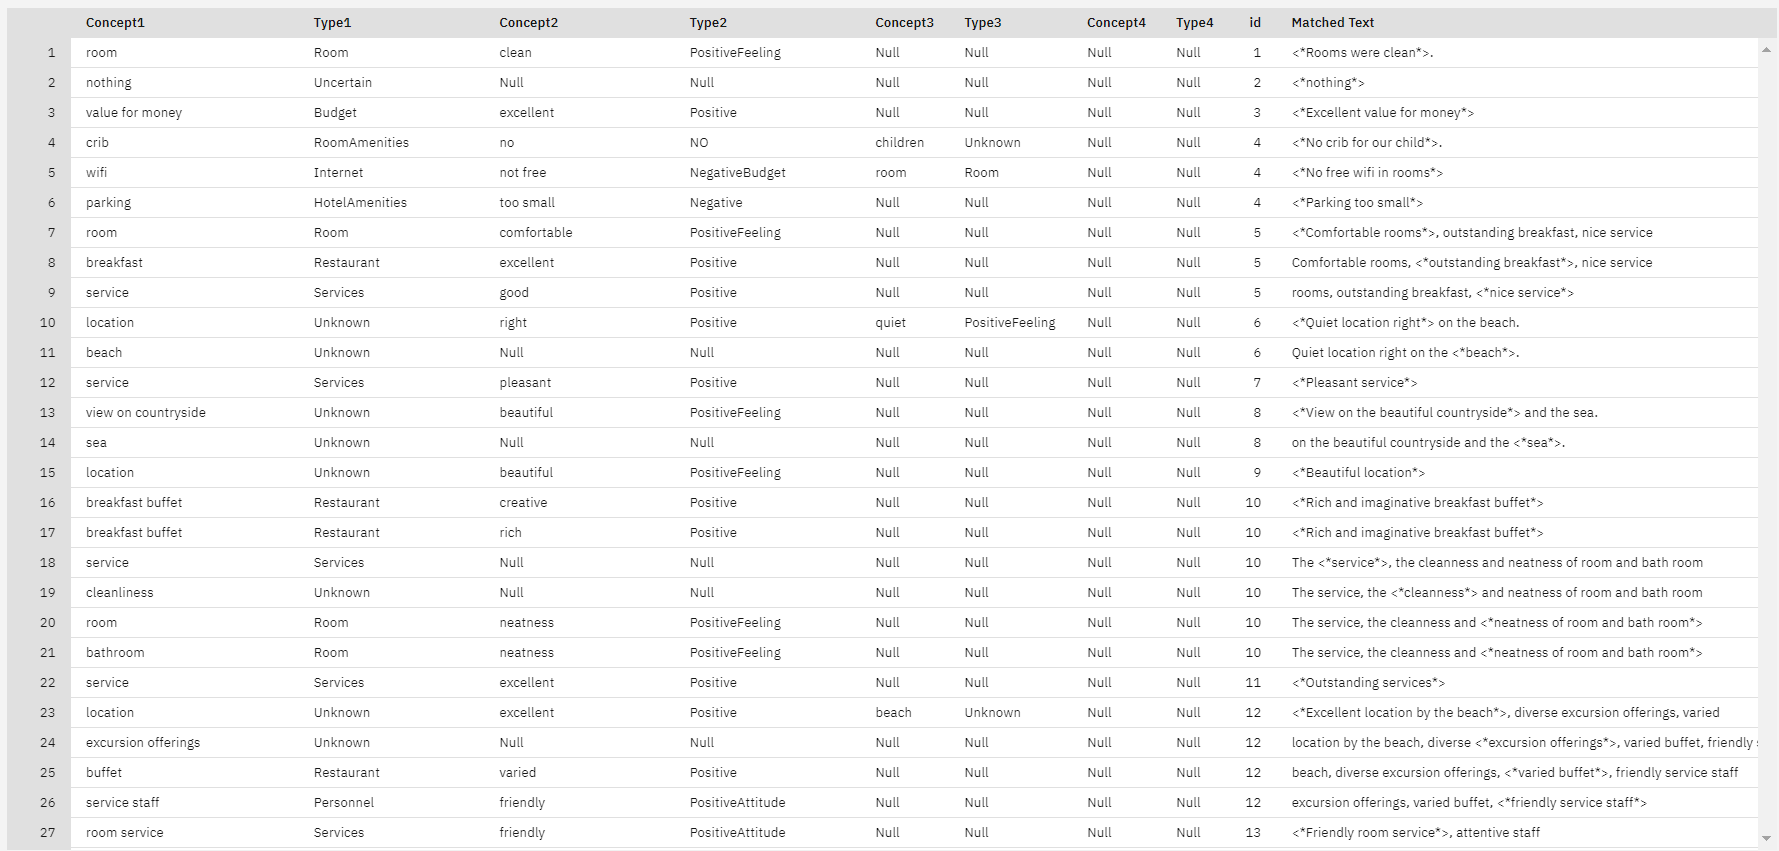
Figure 14. Counting sentiments on a TLA node. 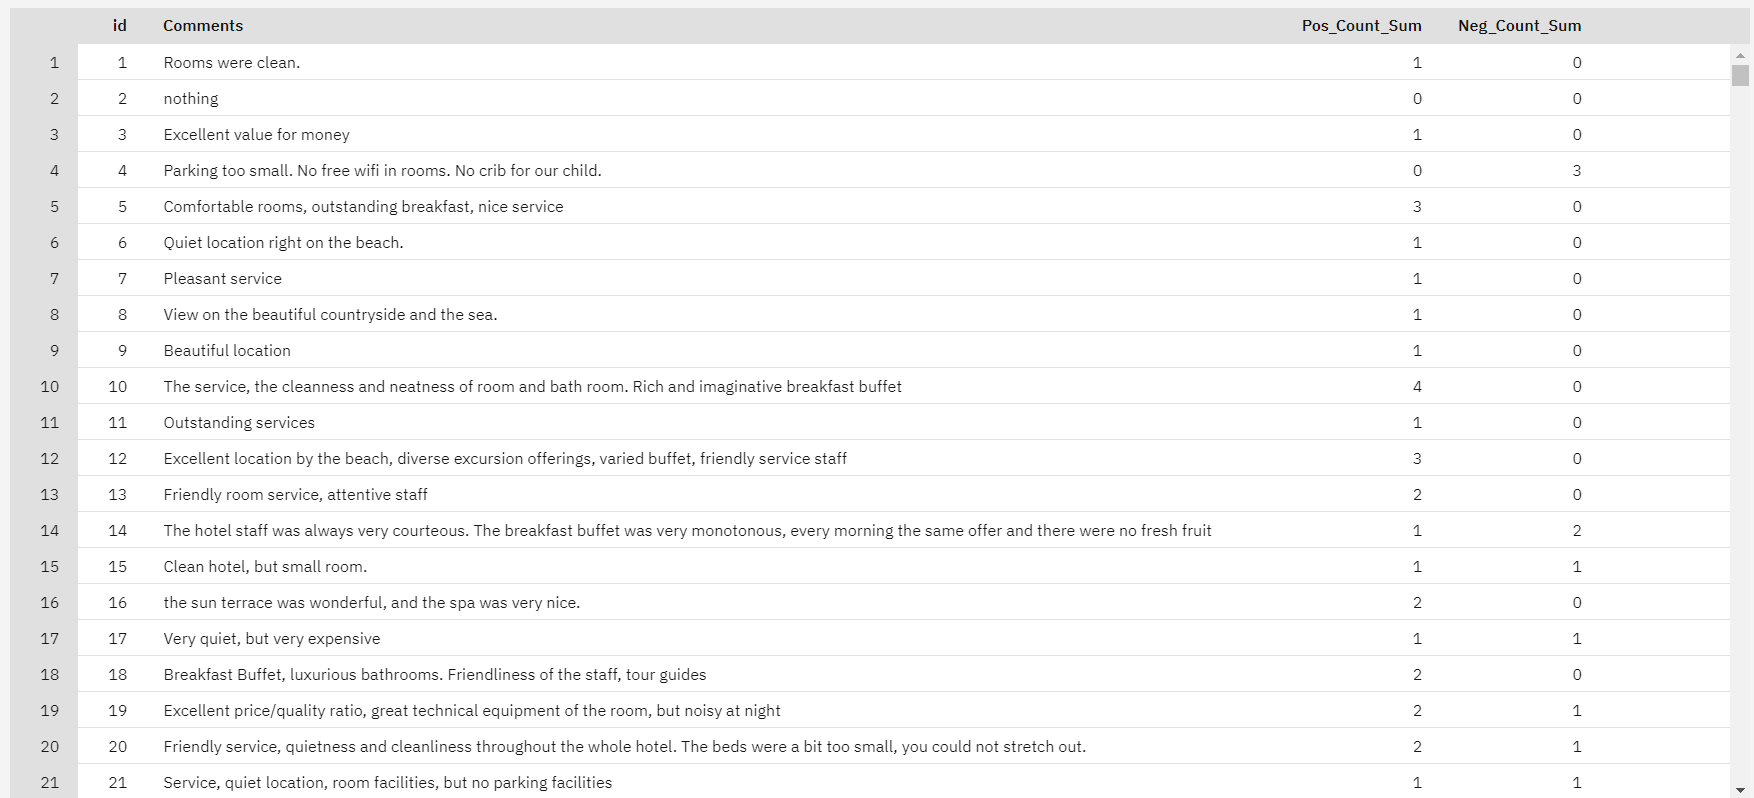
Check your progress
The following image shows the completed flow.
Summary
This Hotel Satisfaction flow showed you how a hotel manager could analyze hotel reviews to see the customers' expressed opinions about hotel personnel, comfort, cleanliness, price, and other areas of interest. This flow illustrates two ways of analyzing text data, by using a Text Mining node or a Text Link Analysis node.
Next steps
You are now ready to try other SPSS® Modeler tutorials.