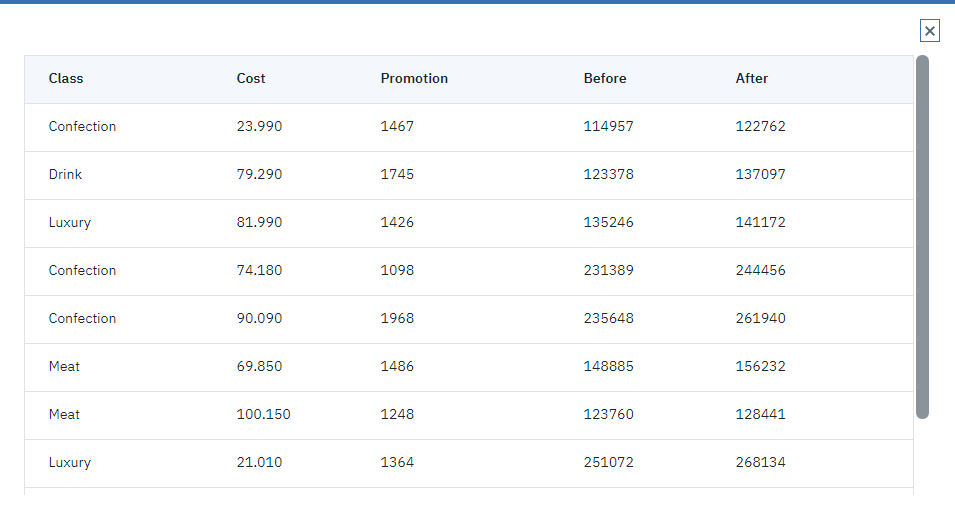
Class. Product type.Cost. Unit price.Promotion. Index of amount spent on a particular promotion.Before. Revenue before promotion.After. Revenue after promotion.
The flow is simple. It displays the data in a table. The two revenue fields
(Before and After) are expressed in absolute terms. However, it
seems likely that the increase in revenue after the promotion (and presumably as a result of it)
would be a more useful figure.

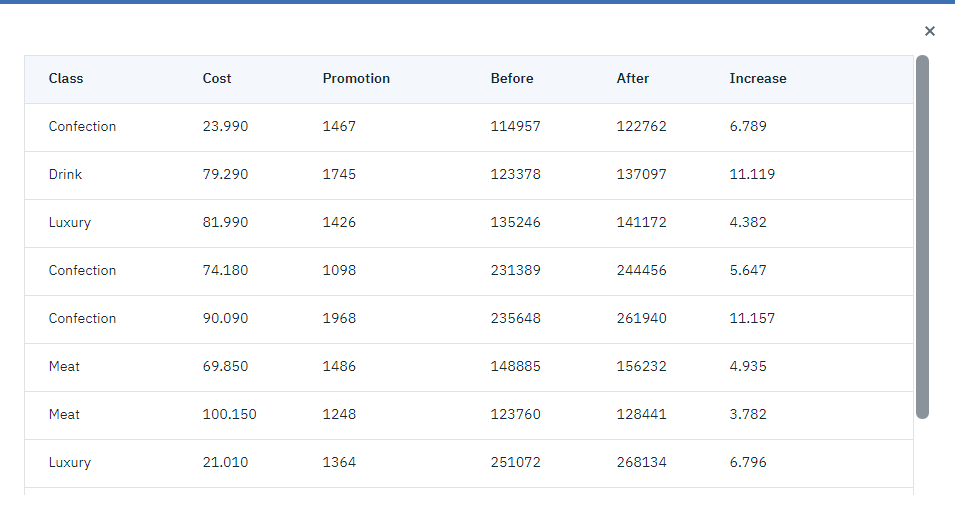
The flow also contains a node to derive this value, expressed as a percentage of the revenue
before the promotion, in a field called Increase. A table shows this field.

For each class of product, and almost linear relationship exists between the increase in revenue and the cost of the promotion. Therefore, it seems likely that a decision tree or neural network could predict, with reasonable accuracy, the increase in revenue from the other available fields.