Last updated: Oct 03, 2024

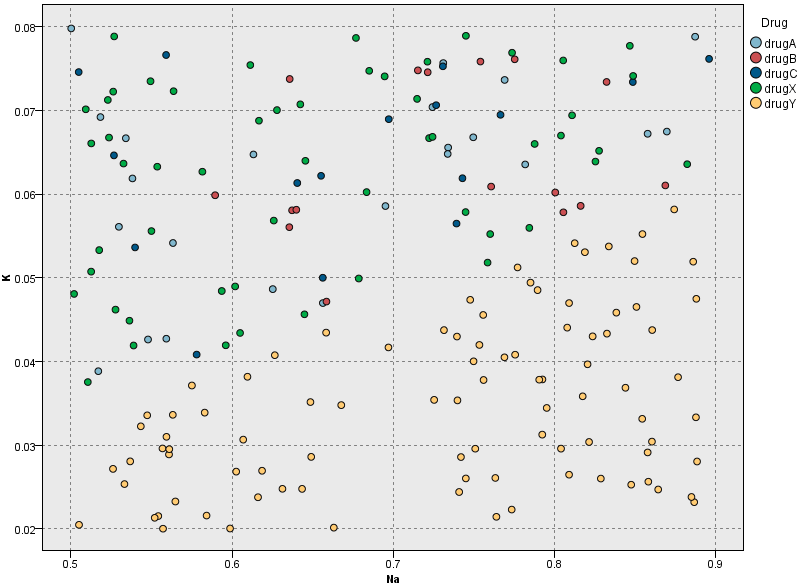
Since the ratio of sodium to potassium seems to predict when to use drug Y, you
can derive a field that contains the value of this ratio for each record. This field might be useful
later when you build a model to predict when to use each of the five drugs.
- To simplify your flow layout, start by deleting all the nodes except the drug1n.csv Data Asset node.
- Place a Derive node on the canvas and connect it to the drug1n.csv Data
Asset node.
Figure 2. Derive node 
- Double-click the Derive node to edit its properties.
- Name the new field Na_to_K. Since you obtain the new field by dividing the sodium value by the potassium value, enter Na/K for the expression. You can also create an expression by clicking the calculator icon. This opens the Expression Builder, a way to interactively create expressions using built-in lists of functions, operands, and fields and their values.
- You can check the distribution of your new field by attaching a Histogram node to the Derive
node. In the Histogram node properties, specify
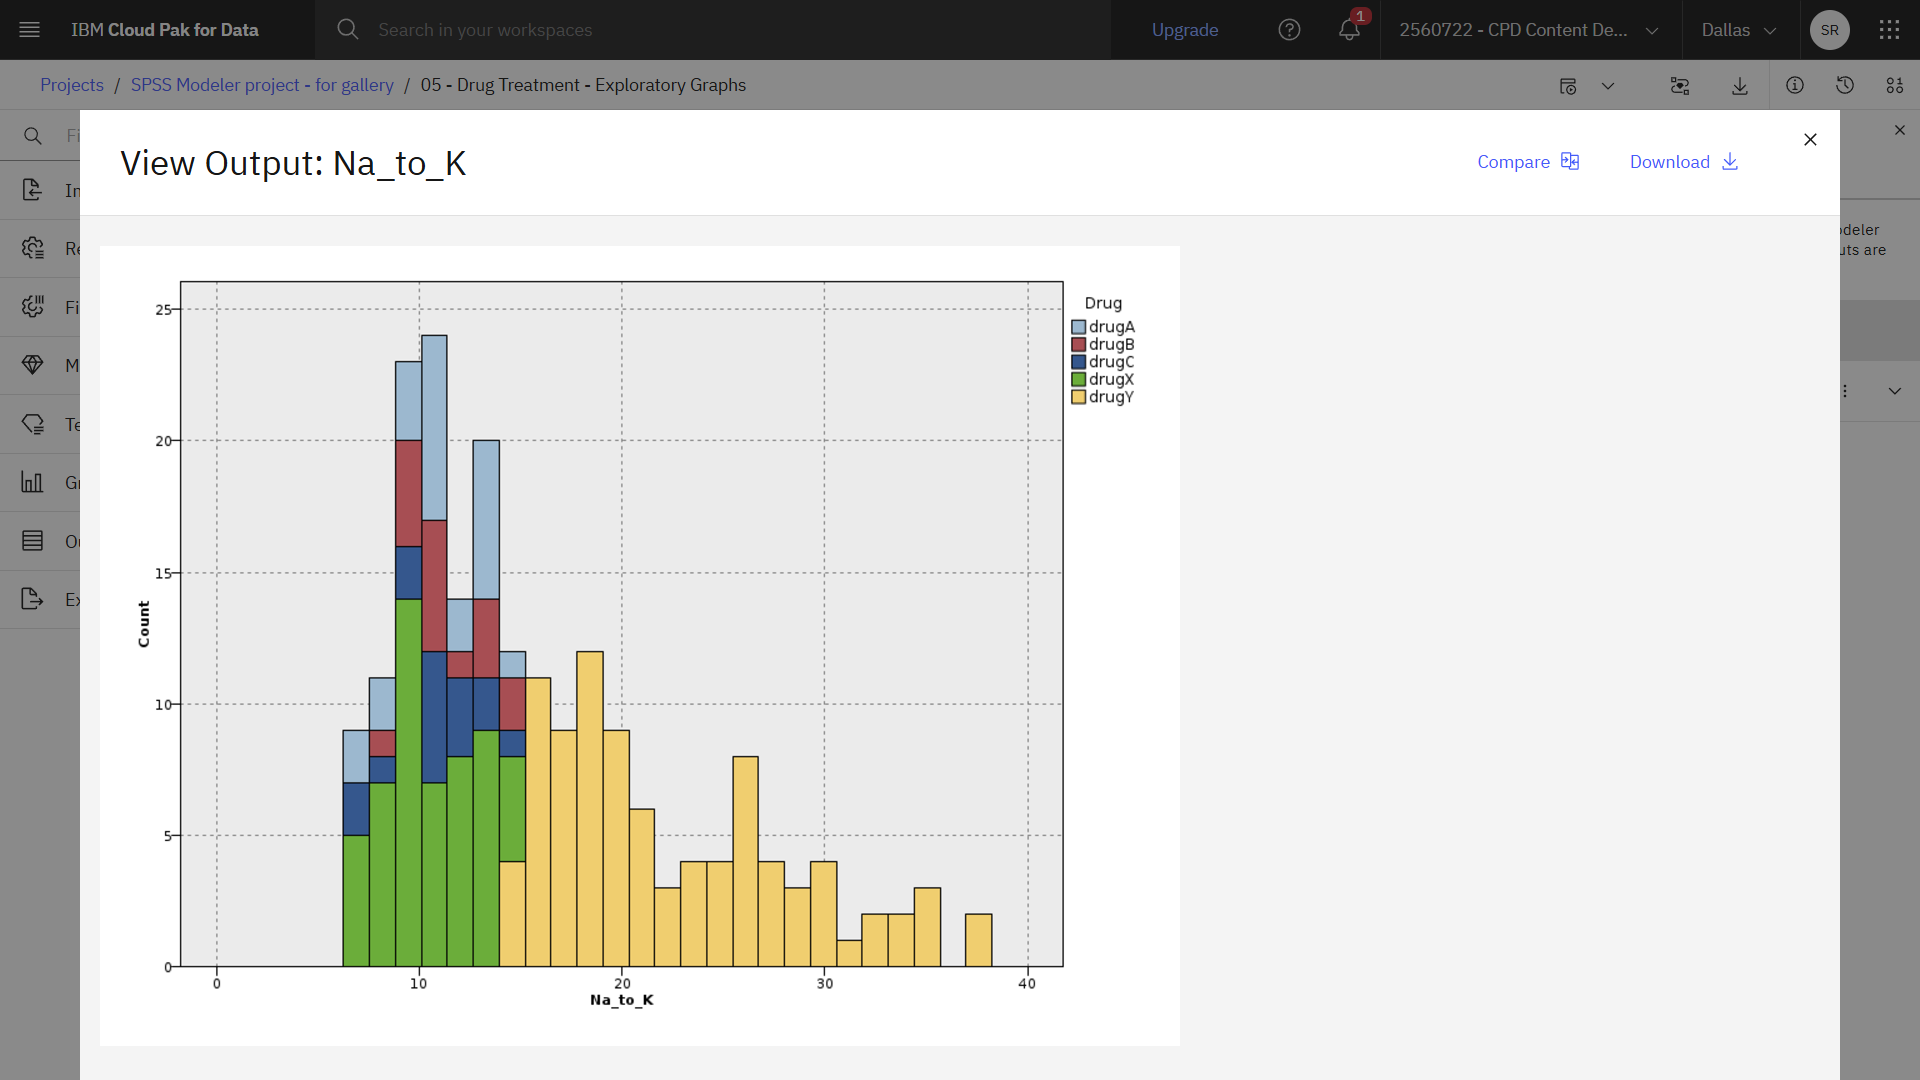
Na_to_Kas the field to be plotted andDrugas the color overlay field.Figure 3. Histogram node 
- Hover
over the Histogram node and click the Run icon
 . A histogram chart is added to the Outputs pane.
Based on the chart, you can conclude that when the
 Na_to_Kvalue is around 15 or more, drugYis the drug of choice.Figure 4. Histogram chart output 