Based on the results of exploring the data, the following flow derives the relevant data and
learns to predict faults.
This example uses the flow named Condition Monitoring, available in the
example project installed with the product. The data files are cond1n.csv and
cond2n.csv.
On the My Projects screen, click Example
Project.
Scroll down to the Modeler flows section, click View
all, and select the Condition Monitoring flow.
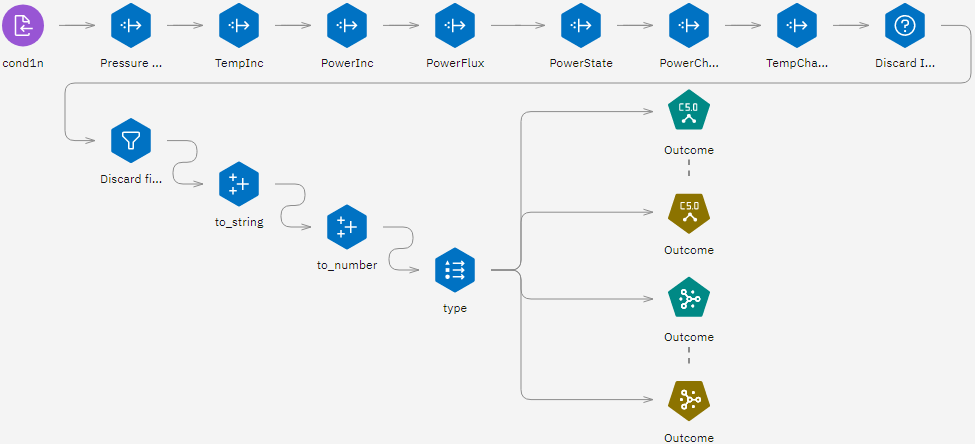
Figure 1. Condition Monitoring example flow
The flow uses a number of Derive nodes to prepare the data for modeling.
Data Asset import node. Reads data file
cond1n.csv.
Pressure Warnings (Derive). Counts the number of momentary pressure
warnings. Reset when time returns to 0.
TempInc (Derive). Calculates momentary rate of temperature change using
@DIFF1.
PowerInc (Derive). Calculates momentary rate of power change using
@DIFF1.
PowerFlux (Derive). A flag, true if power varied in opposite directions
in the last record and this one; that is, for a power peak or trough.
PowerState (Derive). A state that starts as Stable and
switches to Fluctuating when two successive power fluxes are detected. Switches
back to Stable only when there hasn't been a power flux for five time intervals or
when Time is reset.
PowerChange (Derive). Average of PowerInc over the last
five time intervals.
TempChange (Derive). Average of TempInc over the last
five time intervals.
Discard Initial (Select). Discards the first record of each time series
to avoid large (incorrect) jumps in Power and Temperature at
boundaries.
Discard fields (Filter). Cuts records down to Uptime,
Status, Outcome, Pressure Warnings,
PowerState, PowerChange, and TempChange.
Type. Defines the role of Outcome as Target (the field
to predict). In addition, defines the measurement level of Outcome as Nominal,
Pressure Warnings as Continuous, and PowerState as Flag.