Last updated: Jun 07, 2024

- Add a Data Asset node that points to telco.csv.
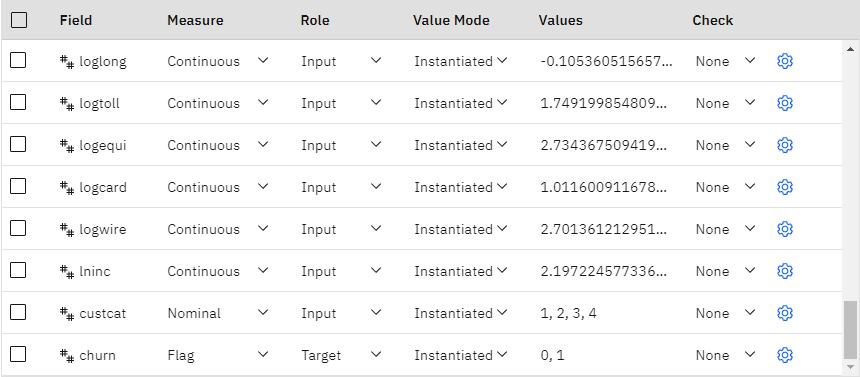
- Add a Type node, double-click it to open its properties, and make sure all measurement levels
are set correctly. For example, most fields with values of
0and1can be regarded as flags, but certain fields, such as gender, are more accurately viewed as a nominal field with two values.Figure 2. Measurement levels 
- Set the measurement level for the
churnfield to Flag, and set the role to Target. Leave the role for all other fields set to Input. - Add a Feature Selection modeling node to the Type node. You can use a Feature Selection node to remove predictors or data that don't add any useful information about the predictor/target relationship.
- Run the flow. Hover over the resulting model nugget, then click the overflow menu
 and select View Model. You'll see
a list of the most important fields.
 - Add a Filter node after the Type node. Not all of the data in the telco.csv data file will be useful in predicting churn. You can use the filter to only select data considered to be important for use as a predictor (the fields marked as Important in the model generated in the previous step).
- Double-click the Filter node to open its properties, select the option Retain the
selected fields (all other fields are filtered), and add the following important fields
from the Feature Selection model
nugget:
tenure age address income ed employ equip callcard wireless longmon tollmon equipmon cardmon wiremon longten tollten cardten voice pager internet callwait confer ebill loglong logtoll lninc custcat churn - Add a Data Audit output node after the Filter node. Run the Data Audit node, then open the output that was added to the Outputs pane.
- Look at the % Complete column, which lets you identify any fields with
large amounts of missing data. In this case, the only field you need to amend is
logtoll, which is less than 50% complete. - Close the output, and add a Filler node after the Filter node. Double-click the node to open its
properties, click Add Columns, and select the
logtollfield. - Under Replace, select Blank and null values. Click Save to close the node properties.
- Hover over the Filter node, then click the overflow menu
 and select Create supernode. Double-click the supernode and
change its name to Missing Value Imputation.
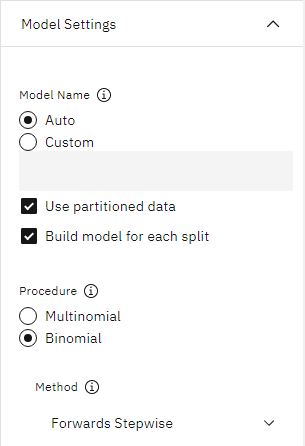
 - Add a Logistic node after the Filler node. Double-click the node to open its properties. Under
Model Settings, select the Binomial procedure and the
Forwards Stepwise method.
Figure 3. Choosing model settings 
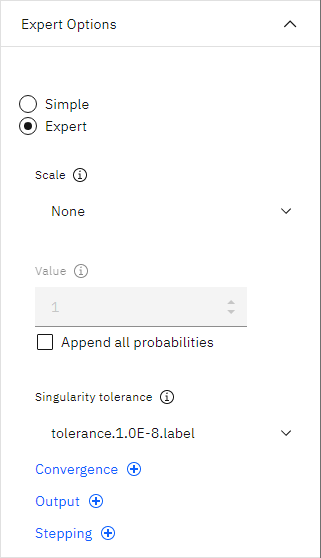
- Under Expert Options, select Expert.
Figure 4. Choosing expert options 
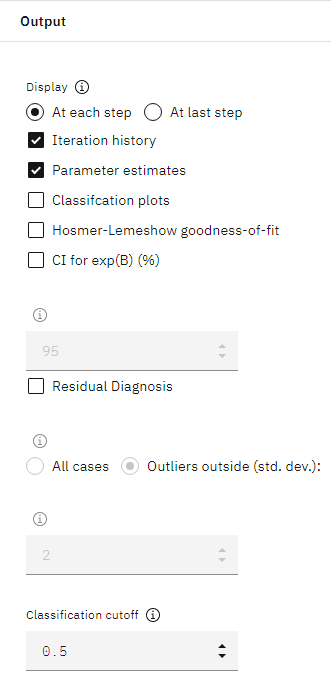
- Click Output to open the display settings. Select At each
step, Iteration history, and Parameter
estimates, then click OK.
Figure 5. Choosing expert options 