- Attach an Auto Classifier node, open its BUILD OPTIONS properties, and select Overall accuracy as the metric used to rank models.
- Set the Number of models to use to 3. This means that
the three best models will be built when you run the node.
Figure 1. Auto Classifier node, build options 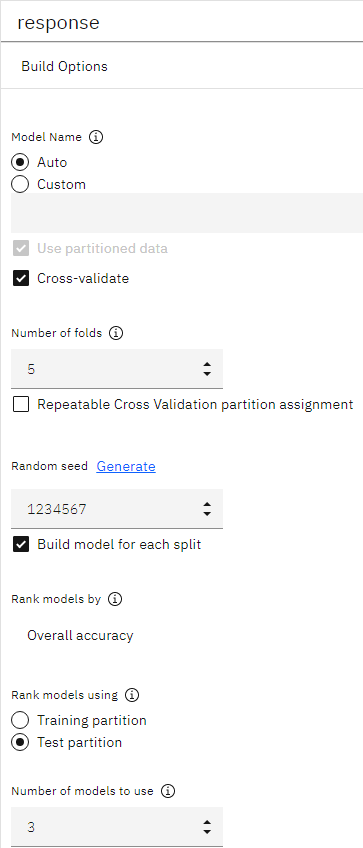
Under the EXPERT options, you can choose from many different modeling algorithms.
- Deselect the Discriminant and
SVM model types. (These models take longer to train on this data, so
deselecting them will speed up the example. If you don't mind waiting, feel free to leave them
selected.)
Because you set Number of models to use to 3 under BUILD OPTIONS, the node will calculate the accuracy of the remaining algorithms and generate a single model nugget containing the three most accurate.
Figure 2. Auto Classifier node, expert options 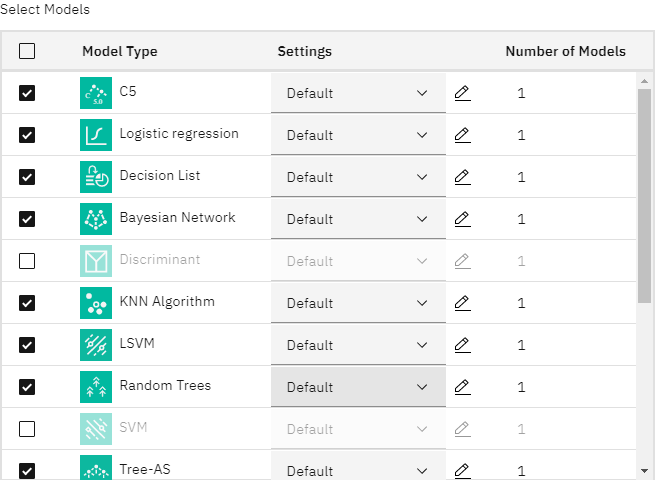
- Under the ENSEMBLE options, select
Confidence-weighted voting for the ensemble method. This determines how a
single aggregated score is produced for each record.
With simple voting, if two out of three models predict yes, then yes wins by a vote of 2 to 1. In the case of confidence-weighted voting, the votes are weighted based on the confidence value for each prediction. Thus, if one model predicts no with a higher confidence than the two yes predictions combined, then no wins.
Figure 3. Auto Classifier node, ensemble options 
- Run the flow. After a few minutes, the generated model nugget is built and placed on the canvas, and results are added to the Outputs panel. You can view the model nugget, or save or deploy it in a number of other ways.
- Right-click the model nugget and select View Model. You'll see details
about each of the models created during the run. (In a real situation, in which hundreds of models
may be created on a large dataset, this could take many hours.)
If you want to explore any of the individual models further, you can click their links in the Estimator column to drill down and browse the individual model results.
Figure 4. Auto Classifier results 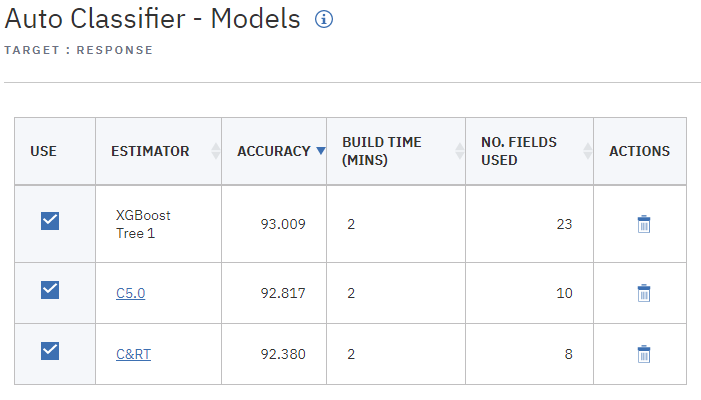
By default, models are sorted based on overall accuracy, because this was the measure you selected in the Auto Classifier node properties. The XGBoost Tree model ranks best by this measure, but the C5.0 and C&RT models are nearly as accurate.
Based on these results, you decide to use all three of these most accurate models. By combining predictions from multiple models, limitations in individual models may be avoided, resulting in a higher overall accuracy.
- In the USE column, select the three models. Return to the flow.
- Attach an Analysis output node after the model nugget. Right-click the Analysis node and choose
Run to run the flow.
Figure 5. Auto Classifier example flow 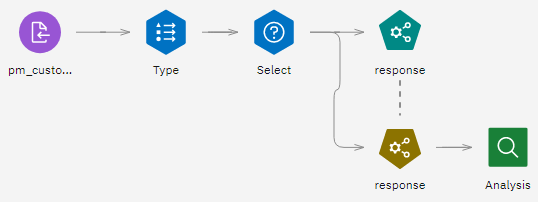
The aggregated score generated by the ensembled model is shown in a field named
$XF-response. When measured against the training data, the predicted value matches the actual response (as recorded in the originalresponsefield) with an overall accuracy of 92.77%. While not quite as accurate as the best of the three individual models in this case (92.82% for C5.0), the difference is too small to be meaningful. In general terms, an ensembled model will typically be more likely to perform well when applied to datasets other than the training data.Figure 6. Analysis of the three ensembled models 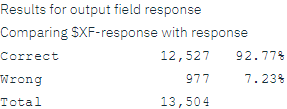
Last updated: Oct 09, 2024
Focus sentinel
Focus sentinel
Focus sentinel
Focus sentinel
Generative AI search and answer
These answers are generated by a large language model in watsonx.ai based on content from the product documentation. Learn more