About cookies on this site Our websites require some cookies to function properly (required). In addition, other cookies may be used with your consent to analyze site usage, improve the user experience and for advertising. For more information, please review your options. By visiting our website, you agree to our processing of information as described in IBM’sprivacy statement. To provide a smooth navigation, your cookie preferences will be shared across the IBM web domains listed here.
Last updated: Feb 12, 2025
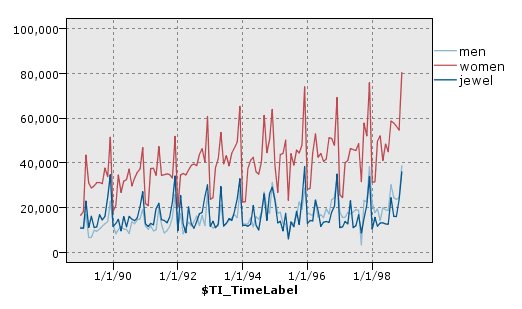
Time Plot nodes allow you to view one or more time series plotted over time. The series you plot must contain numeric values and are assumed to occur over a range of time in which the periods are uniform.
Creating interventions and events
You can create Event and Intervention fields from the time plot by generating a derive (flag or nominal) node from the context menus. For example, you could create an event field in the case of a rail strike, where the drive state is True if the event happened and False otherwise. For an Intervention field, for a price rise for example, you could use a derive count to identify the date of the rise, with 0 for the old price and 1 for the new price. See Derive node for more information.
Was the topic helpful?
0/1000