About cookies on this site Our websites require some cookies to function properly (required). In addition, other cookies may be used with your consent to analyze site usage, improve the user experience and for advertising. For more information, please review your options. By visiting our website, you agree to our processing of information as described in IBM’sprivacy statement. To provide a smooth navigation, your cookie preferences will be shared across the IBM web domains listed here.
Last updated: Feb 12, 2025
The Evaluation node offers an easy way to evaluate and compare predictive models to choose the best model for your application. Evaluation charts show how models perform in predicting particular outcomes. They work by sorting records based on the predicted value and confidence of the prediction, splitting the records into groups of equal size (quantiles), and then plotting the value of the business criterion for each quantile, from highest to lowest. Multiple models are shown as separate lines in the plot.
Outcomes are handled by defining a specific value or range of values as a hit. Hits usually indicate success of some sort (such as a sale to a customer) or an event of interest (such as a specific medical diagnosis). You can define hit criteria under the OPTIONS section of the node properties, or you can use the default hit criteria as follows:
- Flag output fields are straightforward; hits correspond to true values.
- For Nominal output fields, the first value in the set defines a hit.
- For Continuous output fields, hits equal values greater than the midpoint of the field's range.
There are six types of evaluation charts, each of which emphasizes a different evaluation criterion.
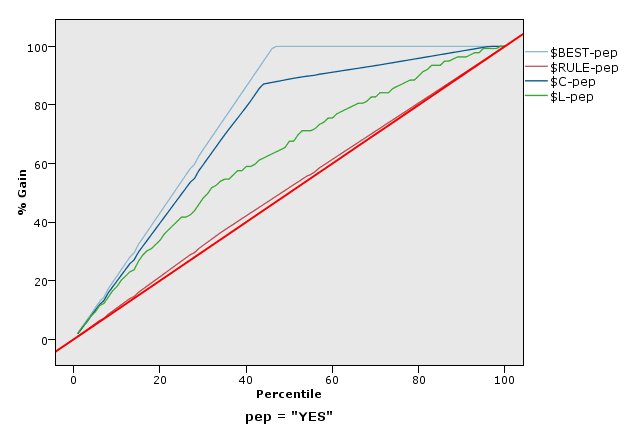
Gains charts
Gains are defined as the proportion of total hits that occurs in each
quantile. Gains are computed as (number of hits in quantile / total number of hits) ×
100%
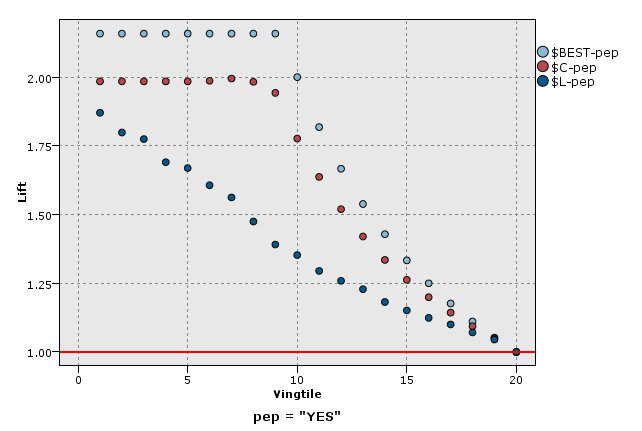
Lift charts
Lift compares the percentage of records in each quantile that are hits with
the overall percentage of hits in the training data. It is computed as (hits in quantile /
records in quantile) / (total hits / total records)
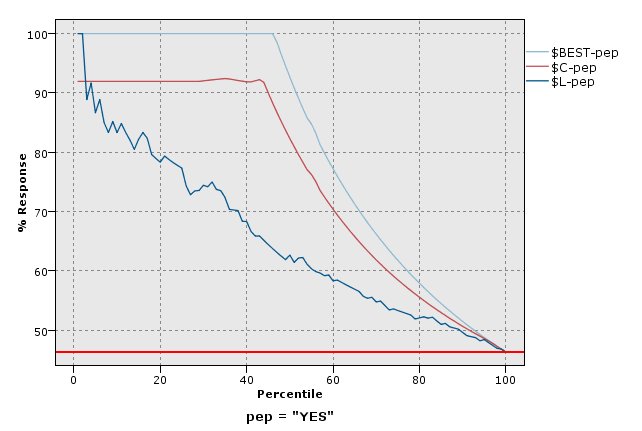
Response charts
Response is simply the percentage of records in the quantile that are hits.
Response is computed as (hits in quantile / records in quantile) × 100%
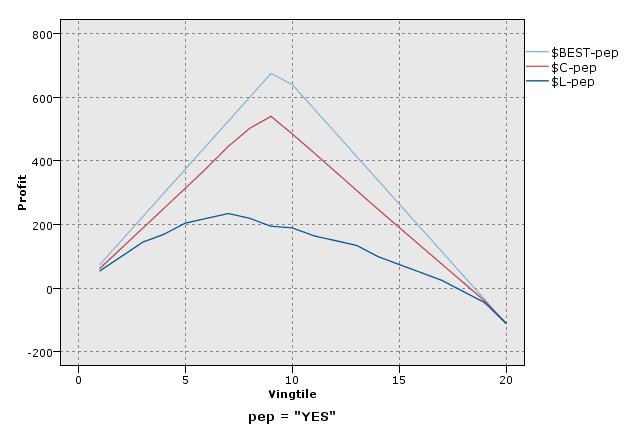
Profit charts
Profit equals the revenue for each record minus the
cost for the record. Profits for a quantile are simply the sum of profits for all
records in the quantile. Revenues are assumed to apply only to hits, but costs apply to all records.
Profits and costs can be fixed or can be defined by fields in the data. Profits are computed as
(sum of revenue for records in quantile − sum of costs for records in
quantile)
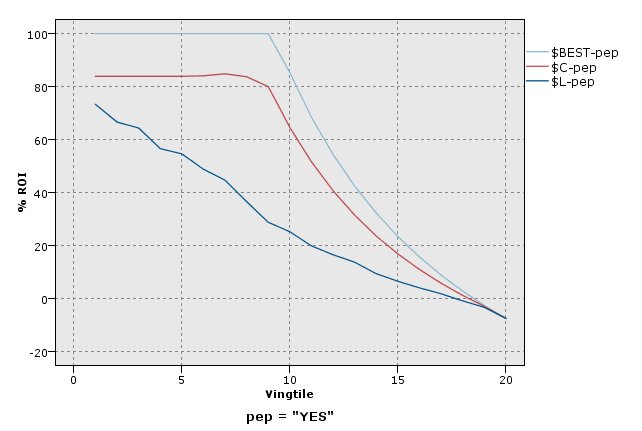
ROI charts
ROI (return on investment) is similar to profit in that it involves defining
revenues and costs. ROI compares profits to costs for the quantile. ROI is computed as
(profits for quantile / costs for quantile) × 100%
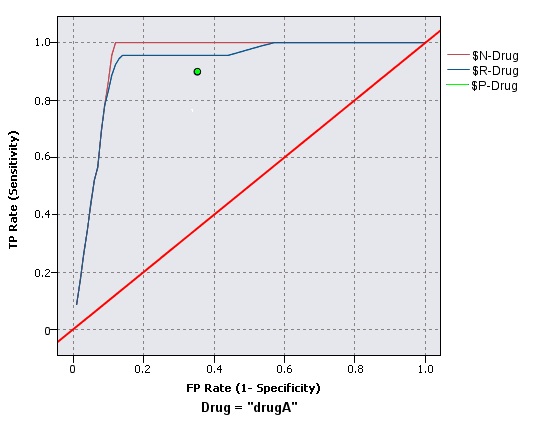
ROC charts
ROC (receiver operator characteristic) can only be used with binary classifiers. ROC can be used to visualize, organize and select classifiers based on their performance. A ROC chart plots the true positive rate (or sensitivity) against the false positive rate of the classifier. A ROC chart depicts the relative trade-offs between benefits (true positives) and costs (false positives). A true positive is an instance that is a hit and is classified as a hit. Therefore the true positive rate is calculated as the number of true positives / number of instances that are actually hits. A false positive is an instance that is a miss and is classified as a hit. Therefore the false positive rate is calculated as the number of false positives / number of instances that are actually misses.
Evaluation charts can also be cumulative, so that each point equals the value for the corresponding quantile plus all higher quantiles. Cumulative charts usually convey the overall performance of models better, whereas noncumulative charts often excel at indicating particular problem areas for models.
Note: The Evaluation node doesn't support the use of commas in field names. If you have field names
containing commas, you must either remove the commas or surround the field name in quotes.
Was the topic helpful?
0/1000