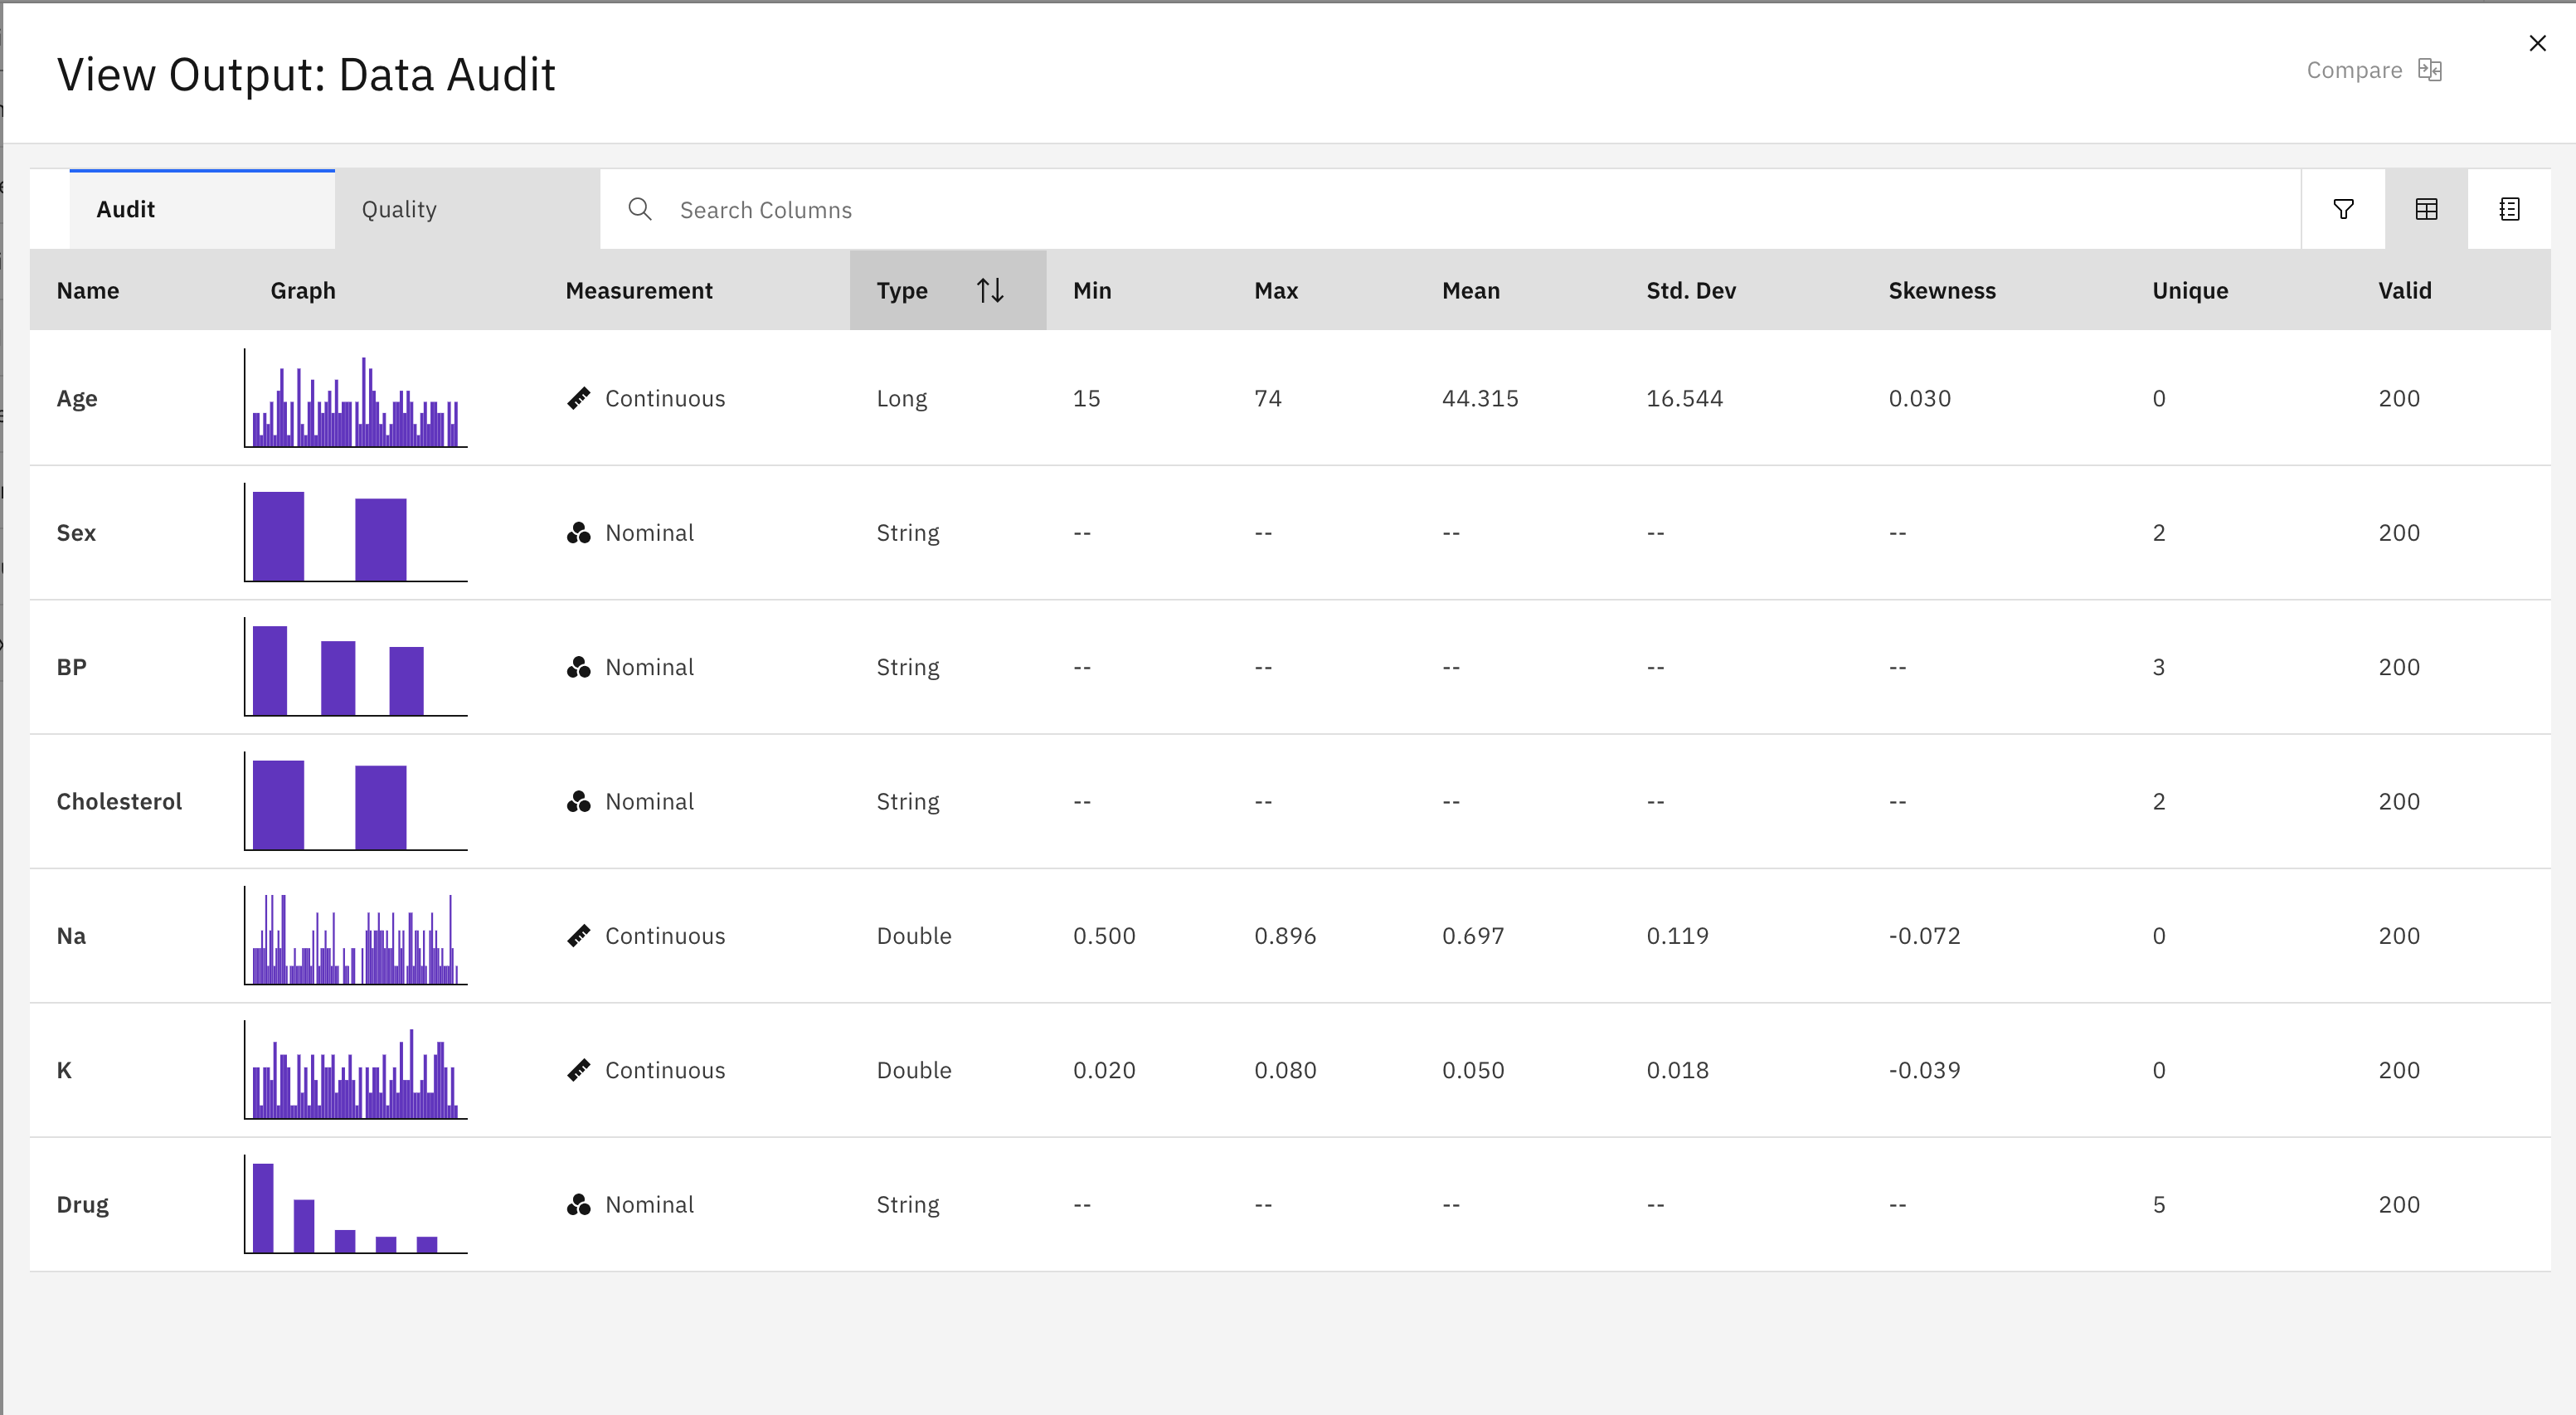
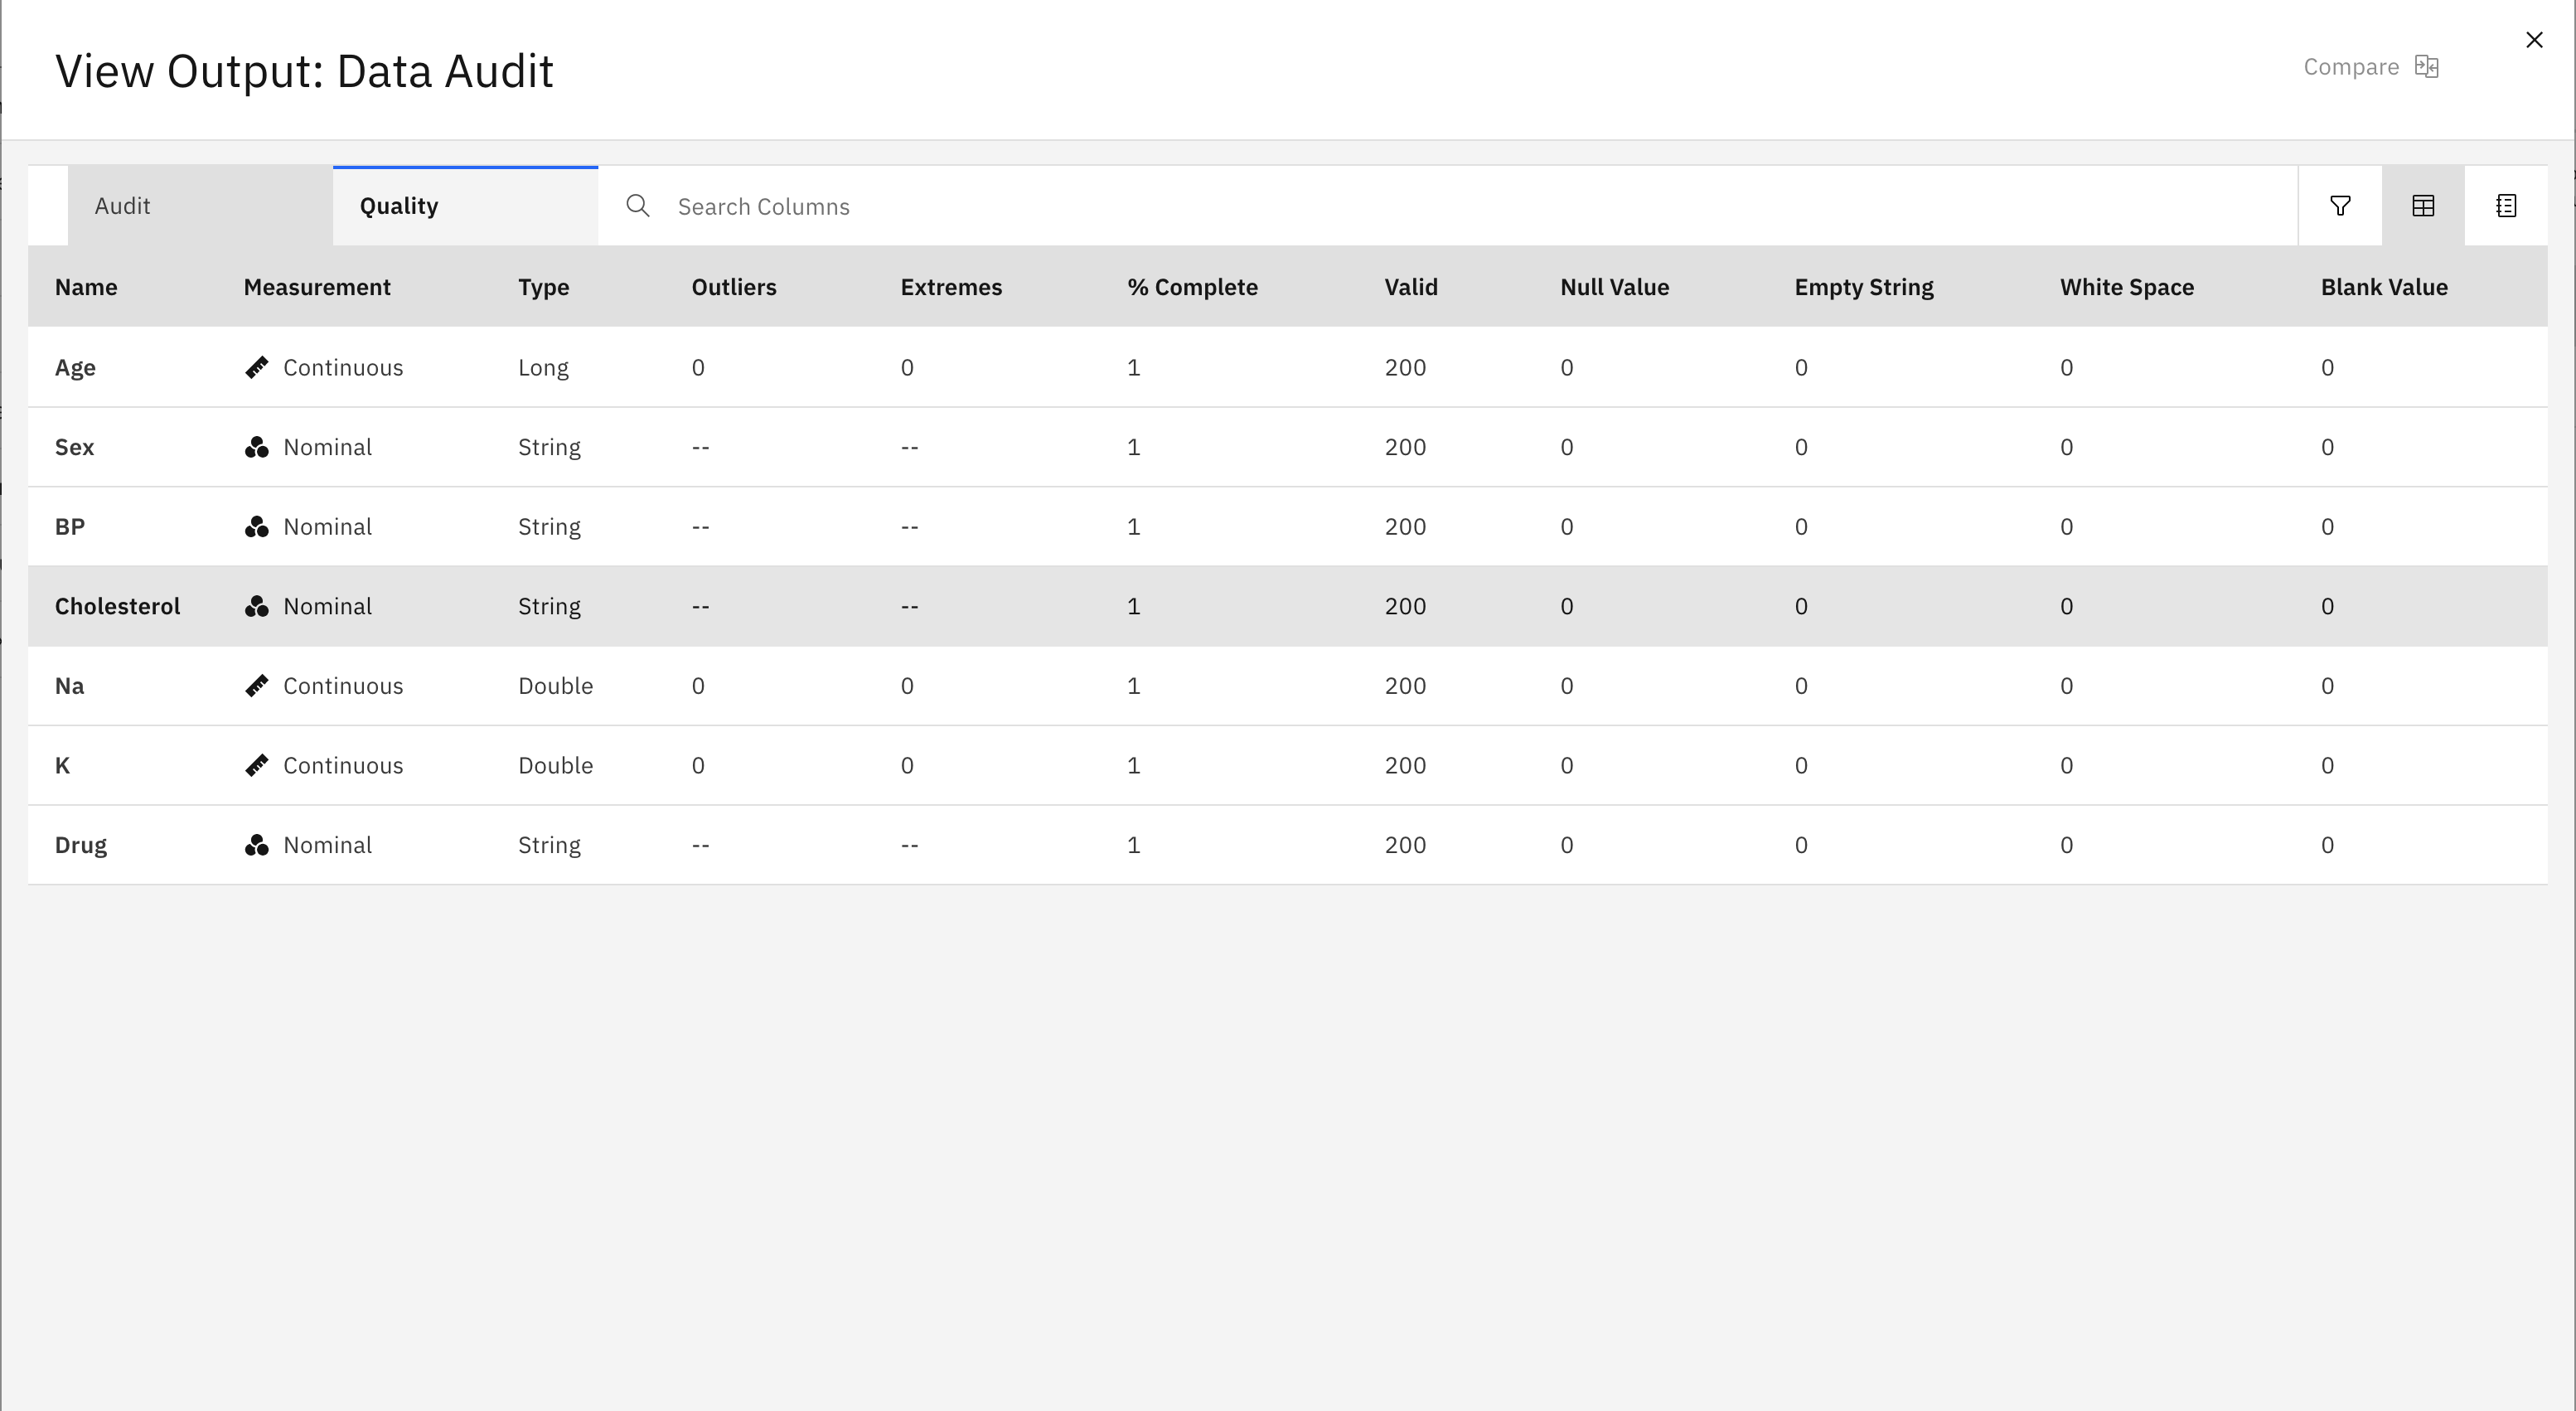
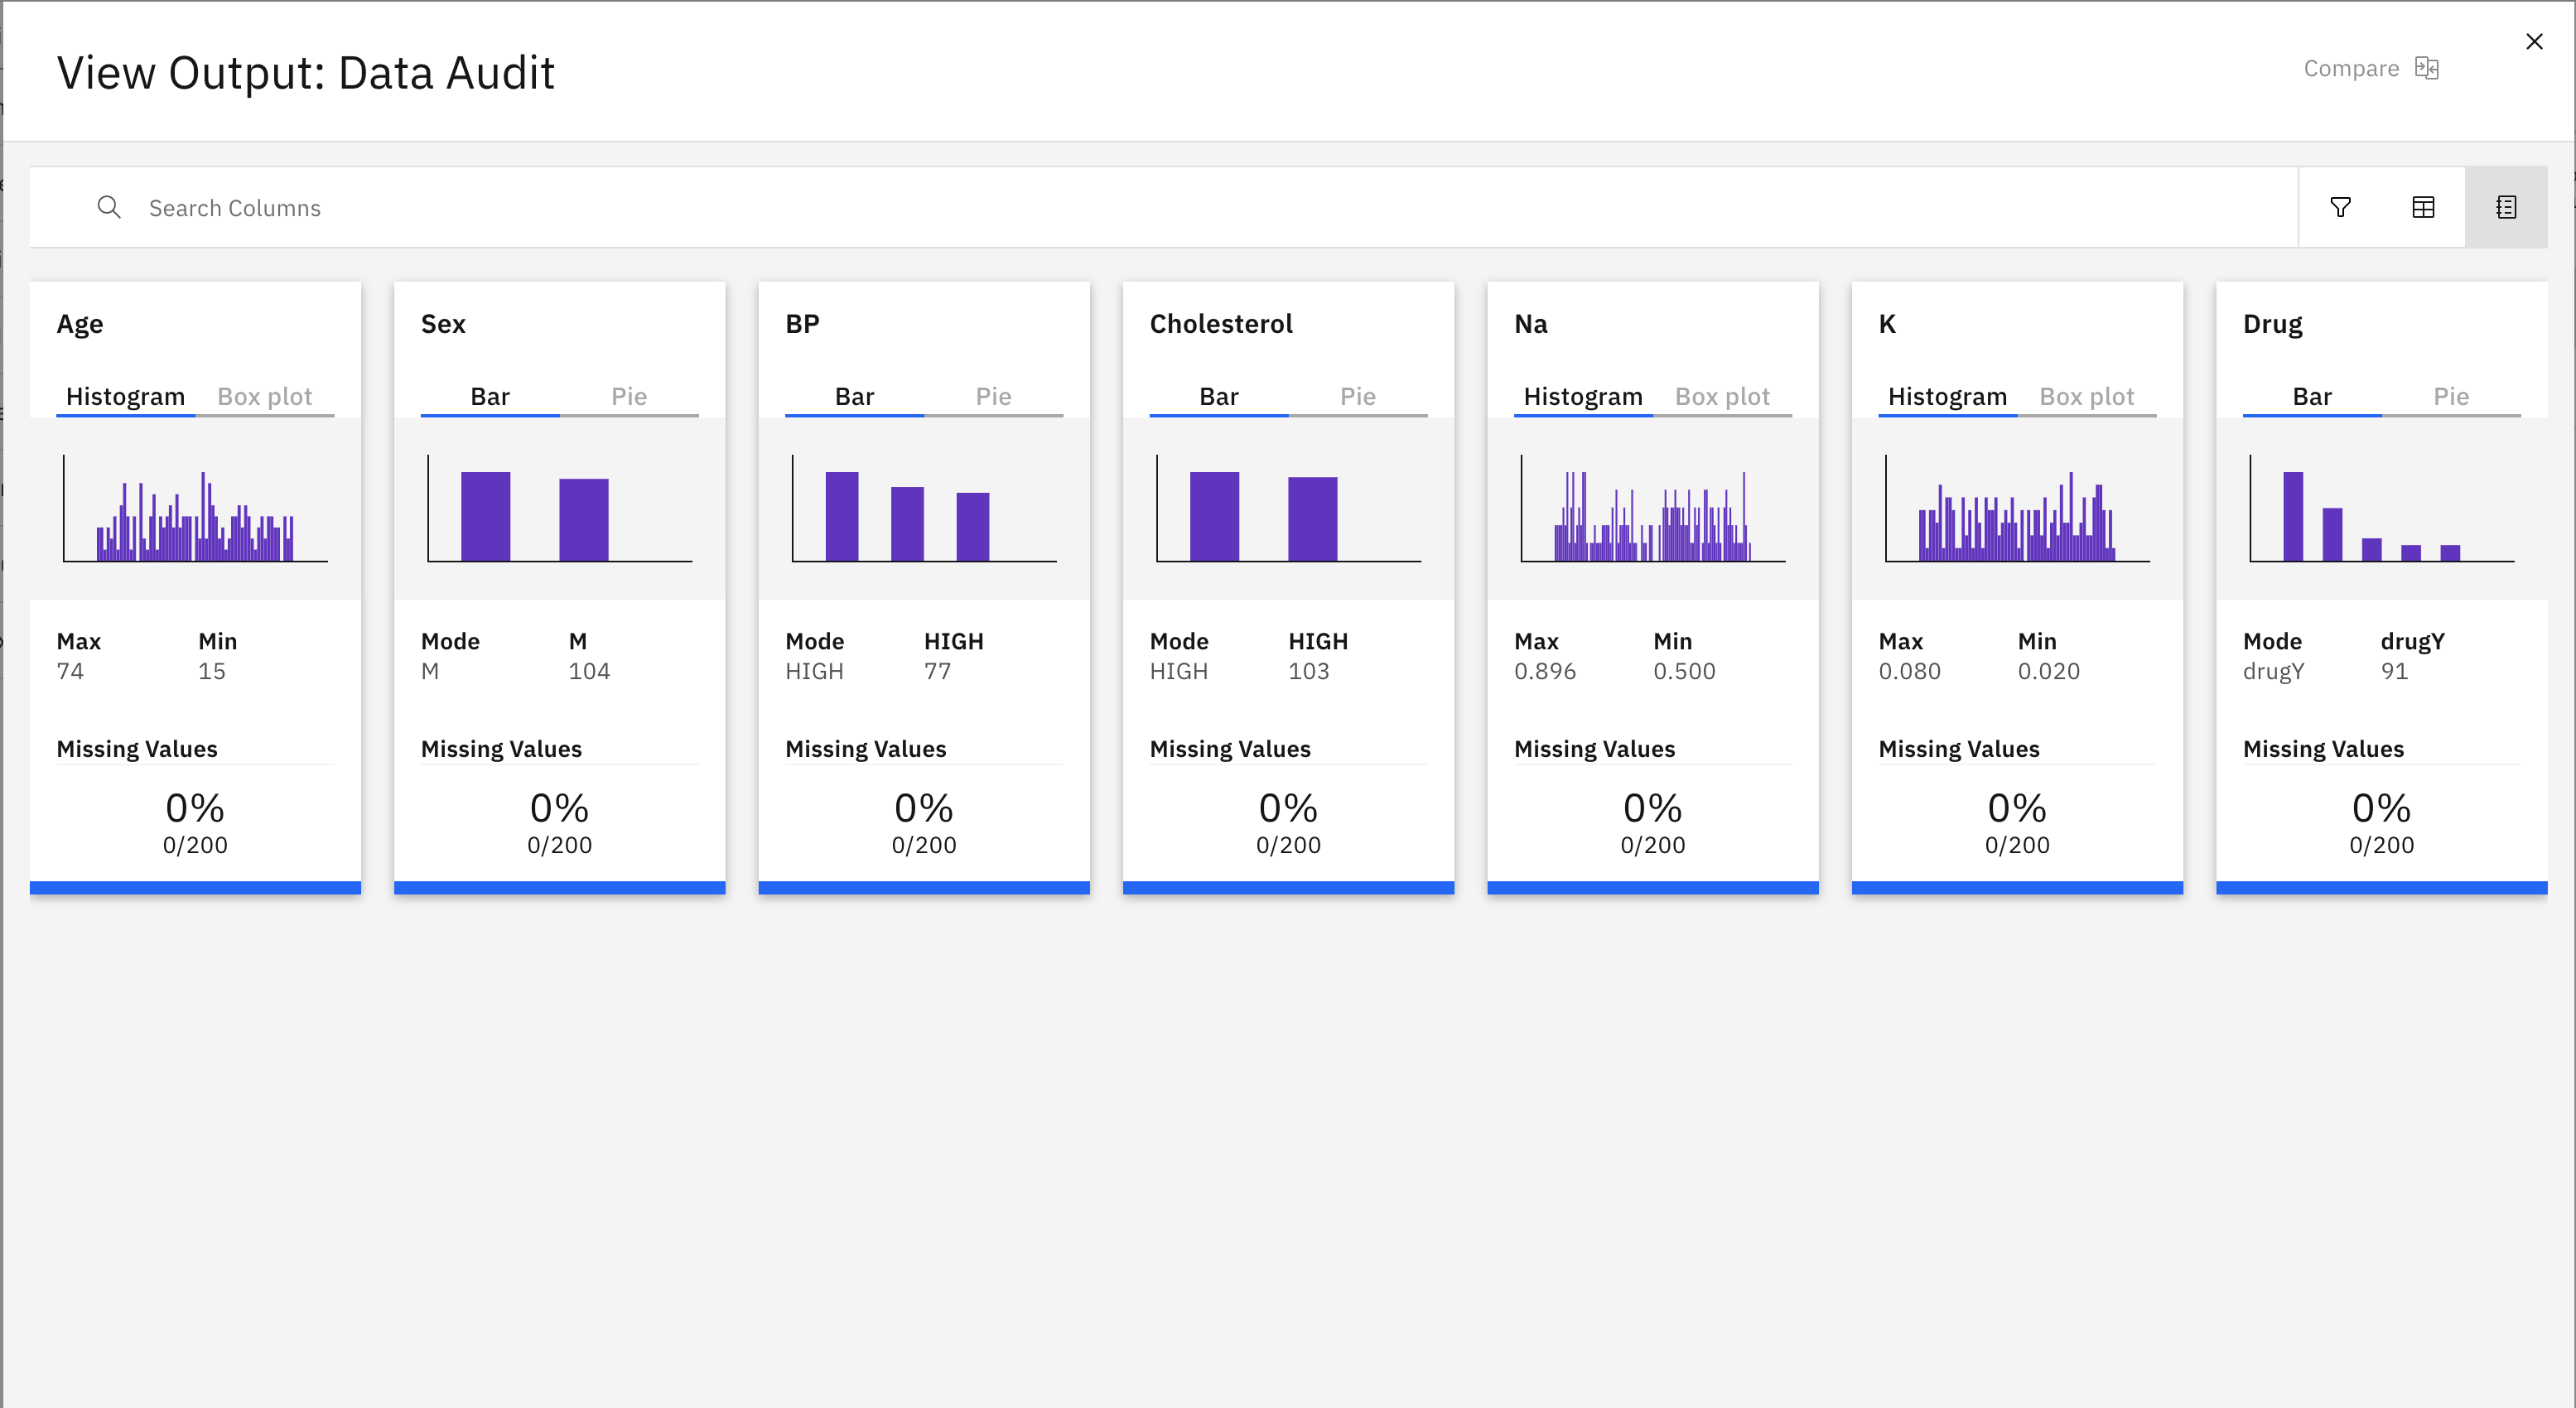
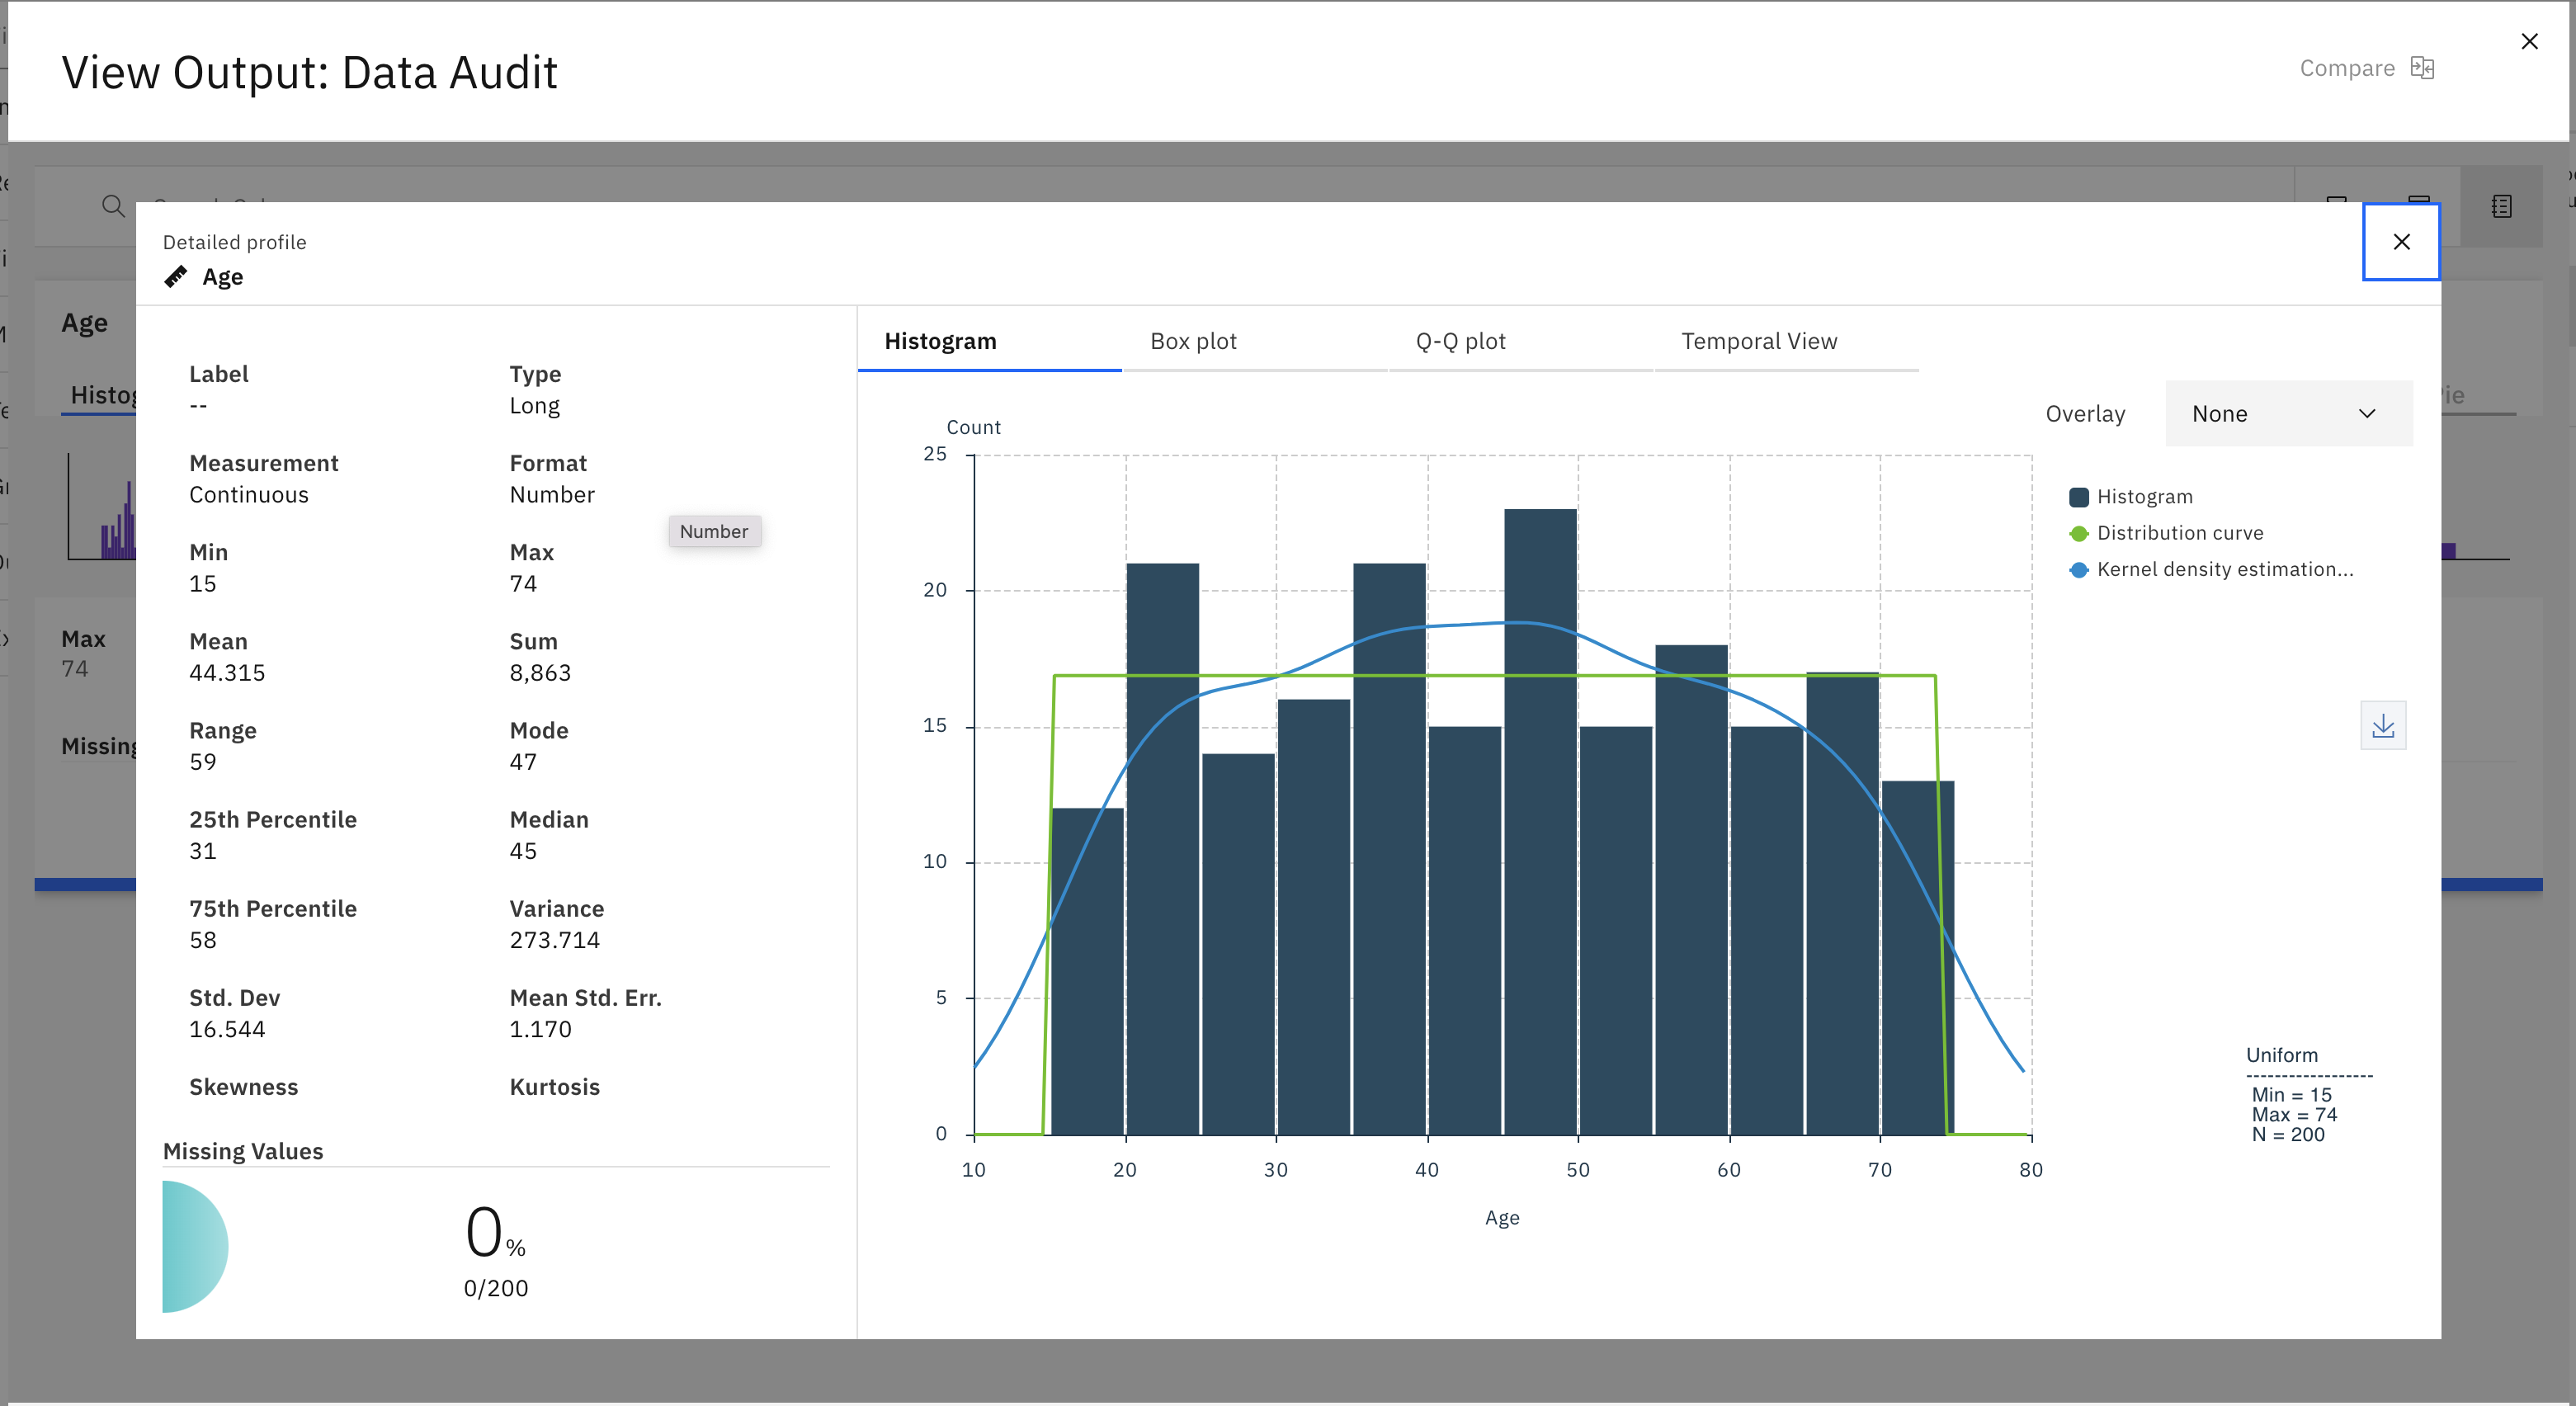
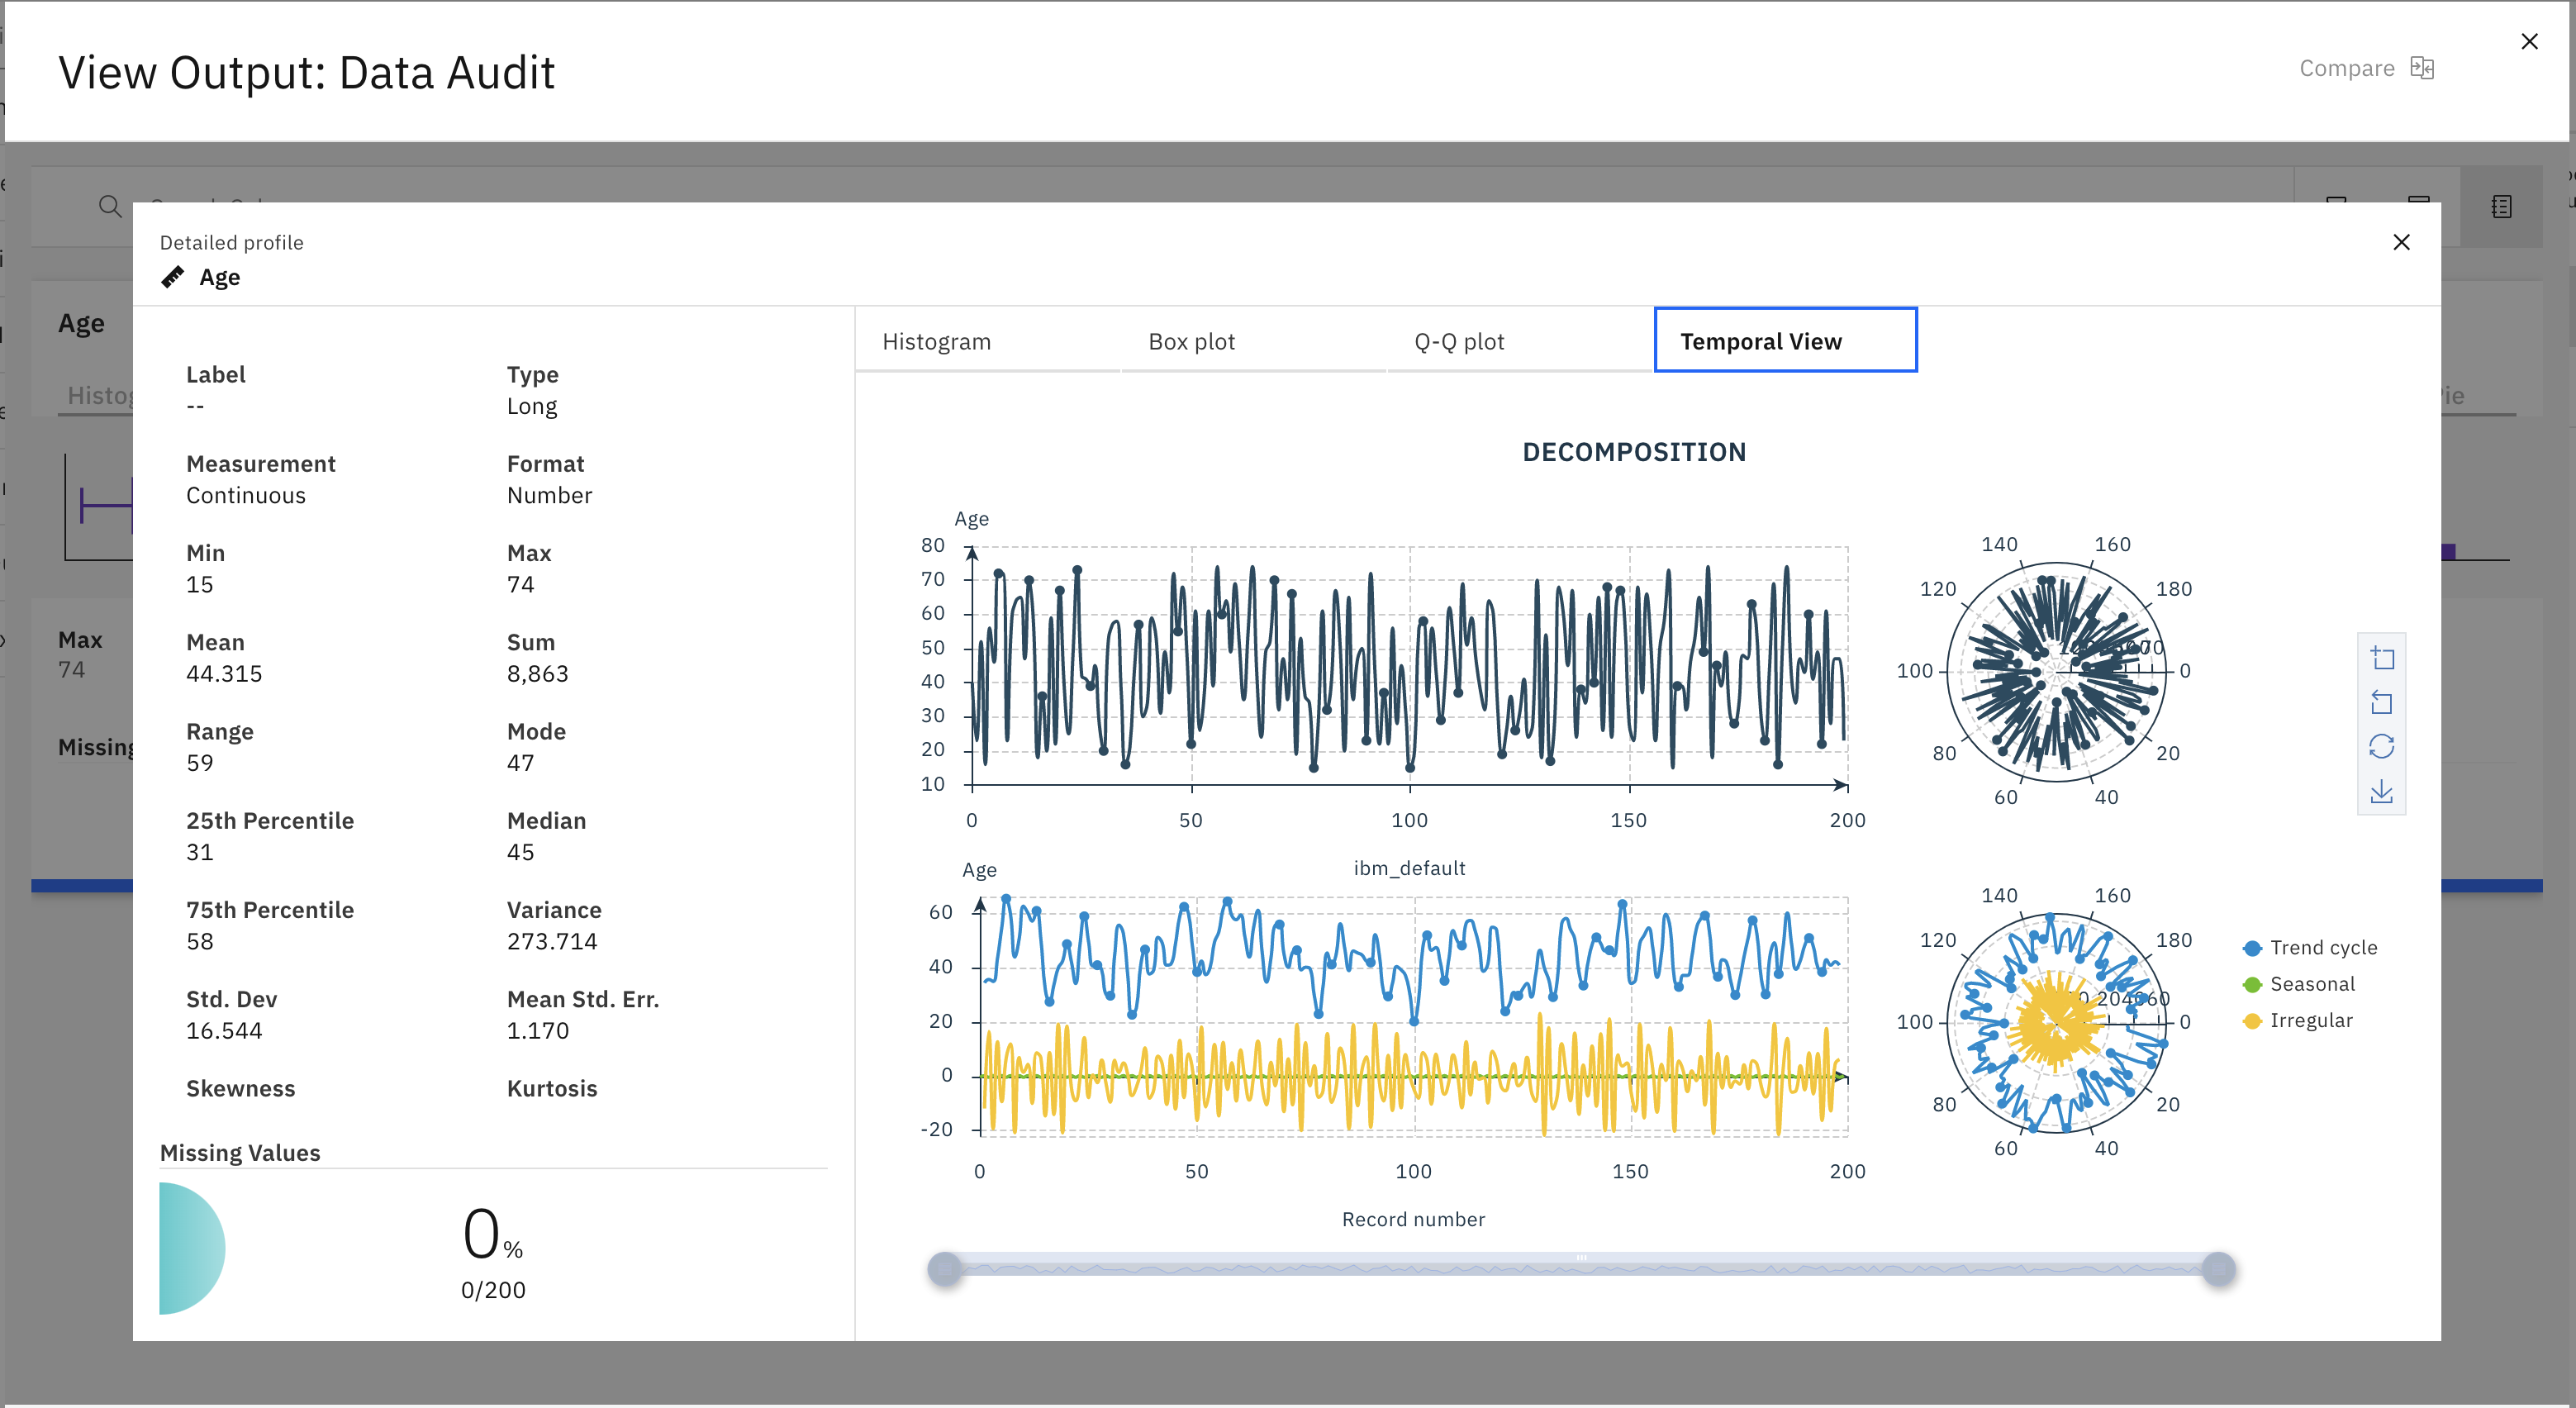
The Data Audit node provides a comprehensive first look at the data you bring to SPSS Modeler, presented in an interactive, easy-to-read matrix that can be sorted and used to generate full-size graphs.
When you run a Data Audit node, interactive output is generated that includes:
- Information such as summary statistics, histograms, box plots, bar charts, pie charts, and more that may be useful in gaining a preliminary understanding of the data.
- Information about outliers, extremes, and missing values.
Using the Data Audit node
The Data Audit node can be attached directly to an Import node or downstream from an instantiated Type node.
Screening or sampling the data. Because an initial audit is particularly effective when dealing with big data, you might use a Sample node to reduce processing time during the initial exploration by selecting only a subset of records. The Data Audit node can also be used in combination with nodes such as Feature Selection and Anomaly Detection in the exploratory stages of analysis.
