About cookies on this site Our websites require some cookies to function properly (required). In addition, other cookies may be used with your consent to analyze site usage, improve the user experience and for advertising. For more information, please review your options. By visiting our website, you agree to our processing of information as described in IBM’sprivacy statement. To provide a smooth navigation, your cookie preferences will be shared across the IBM web domains listed here.
Last updated: Feb 12, 2025
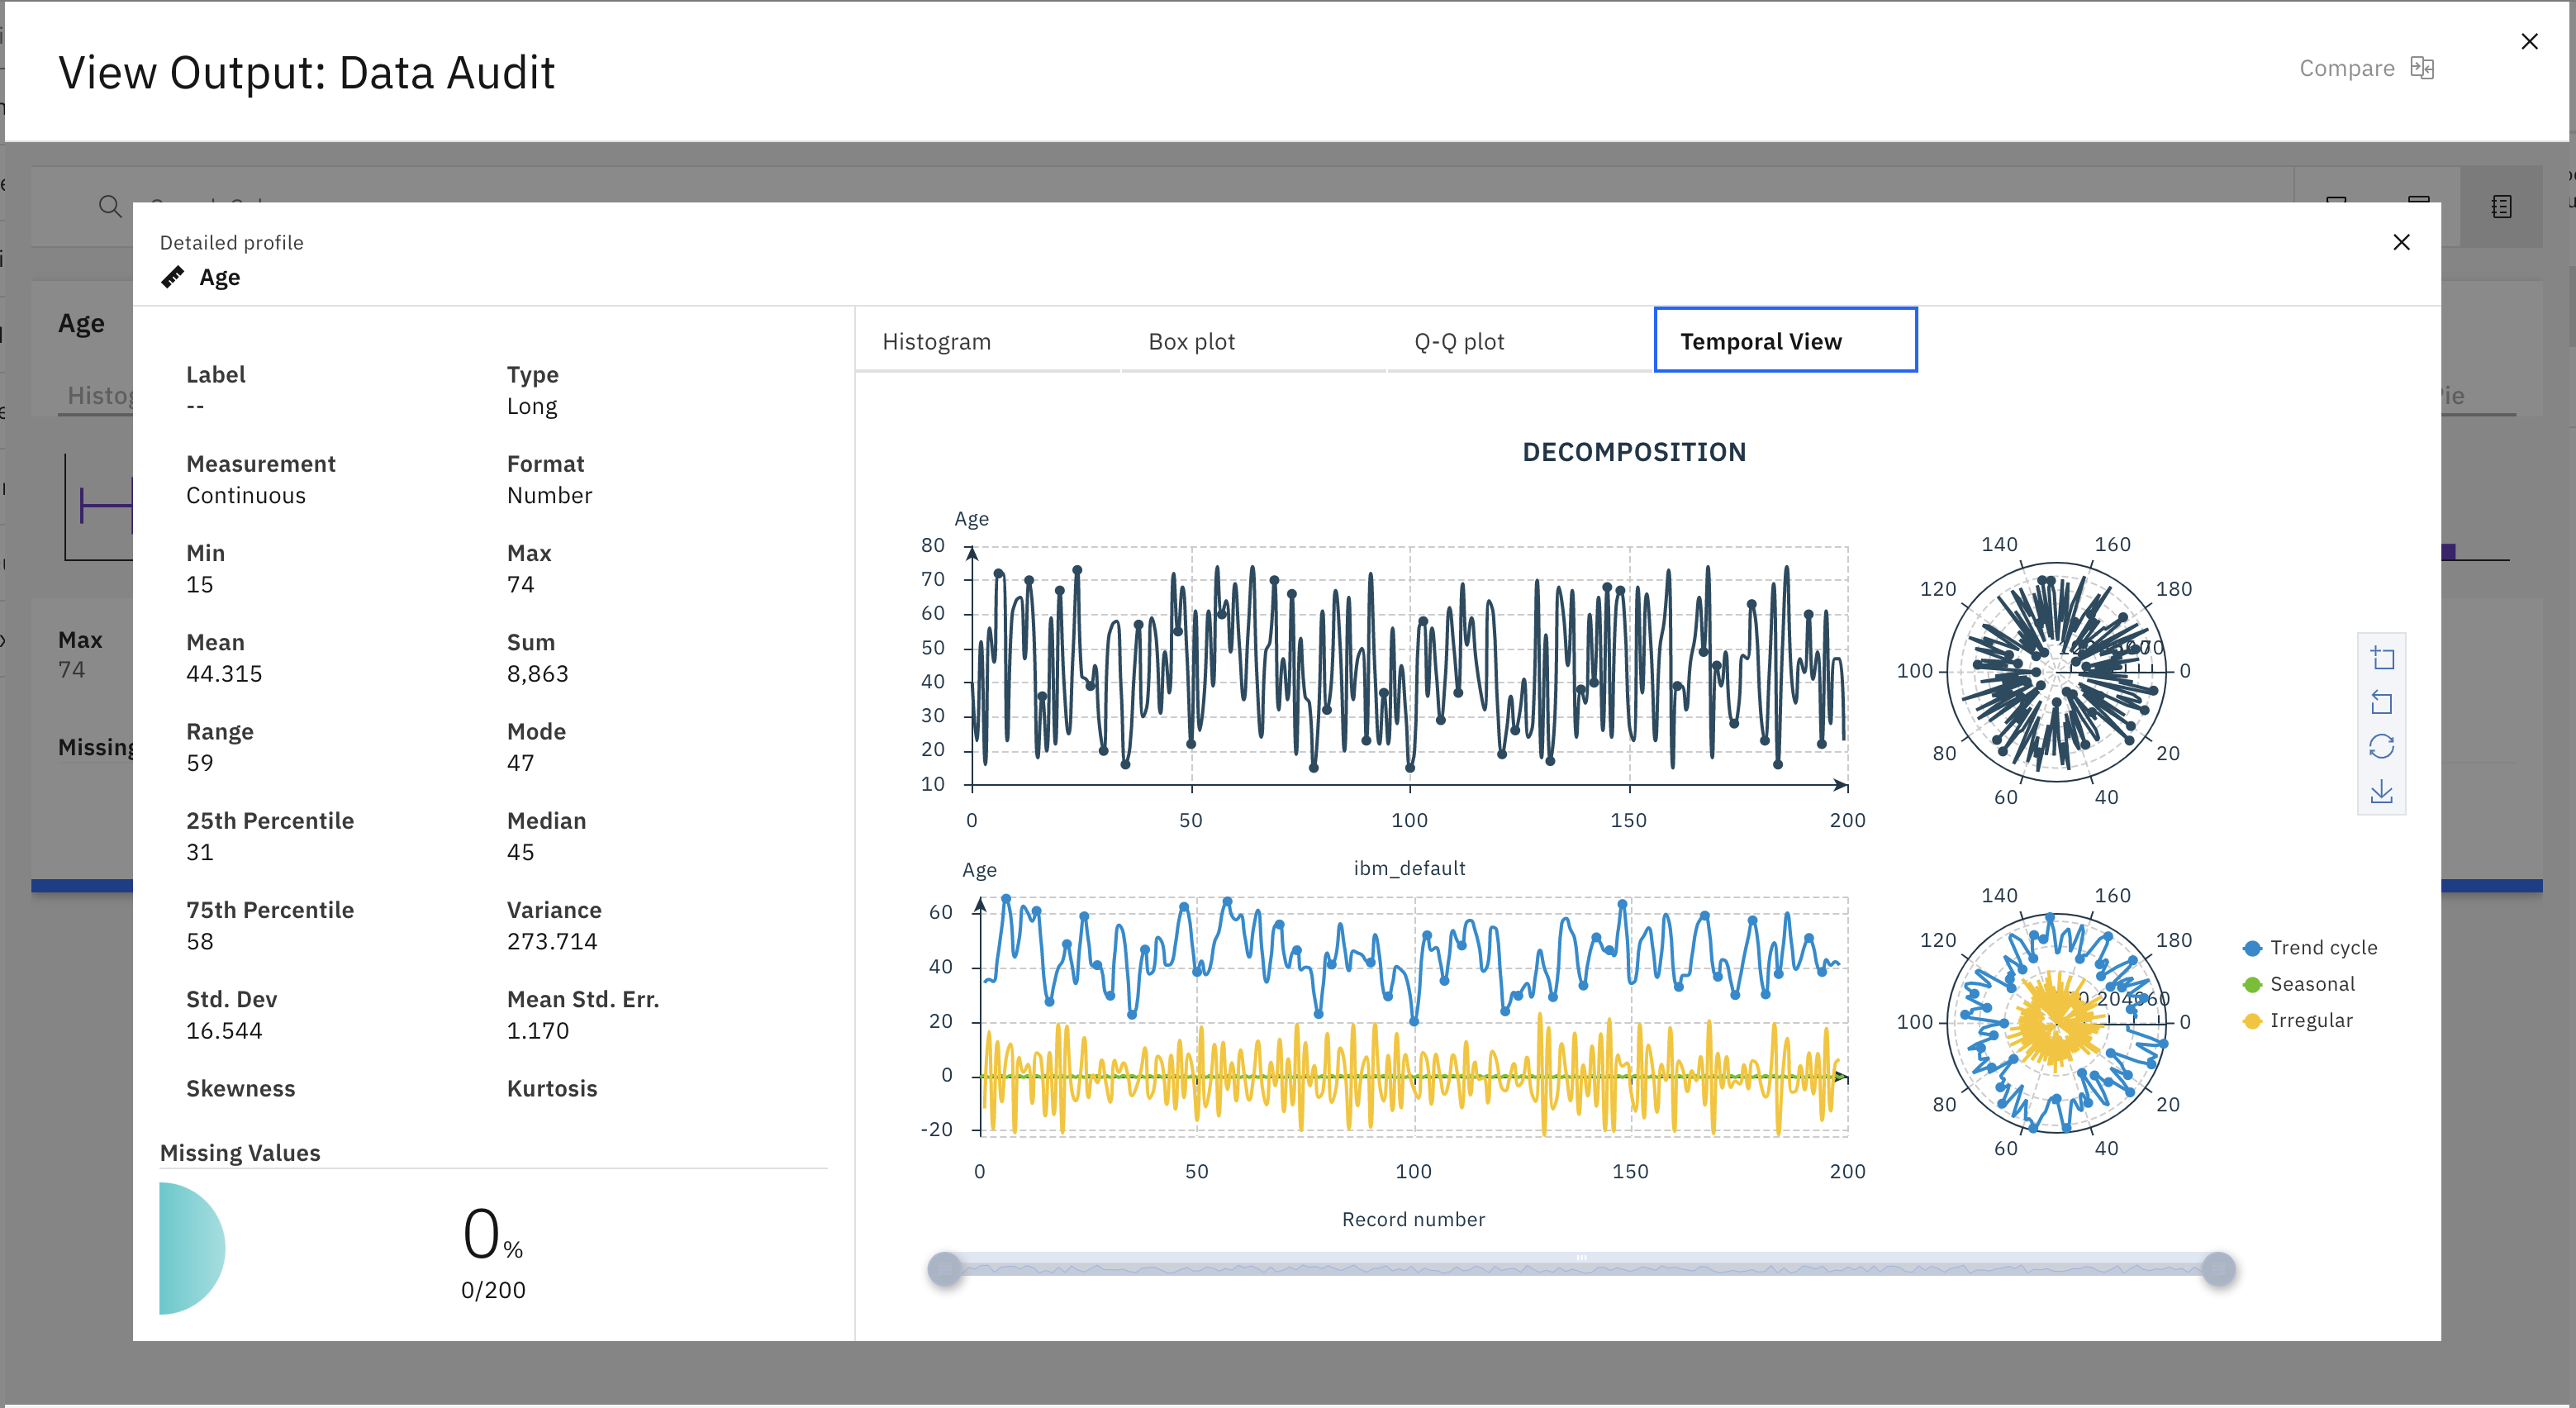
The Data Audit node provides a comprehensive first look at the data that you bring to SPSS Modeler. The data is presented in an interactive, easy-to-read matrix that can be sorted and used to generate full-size graphs.
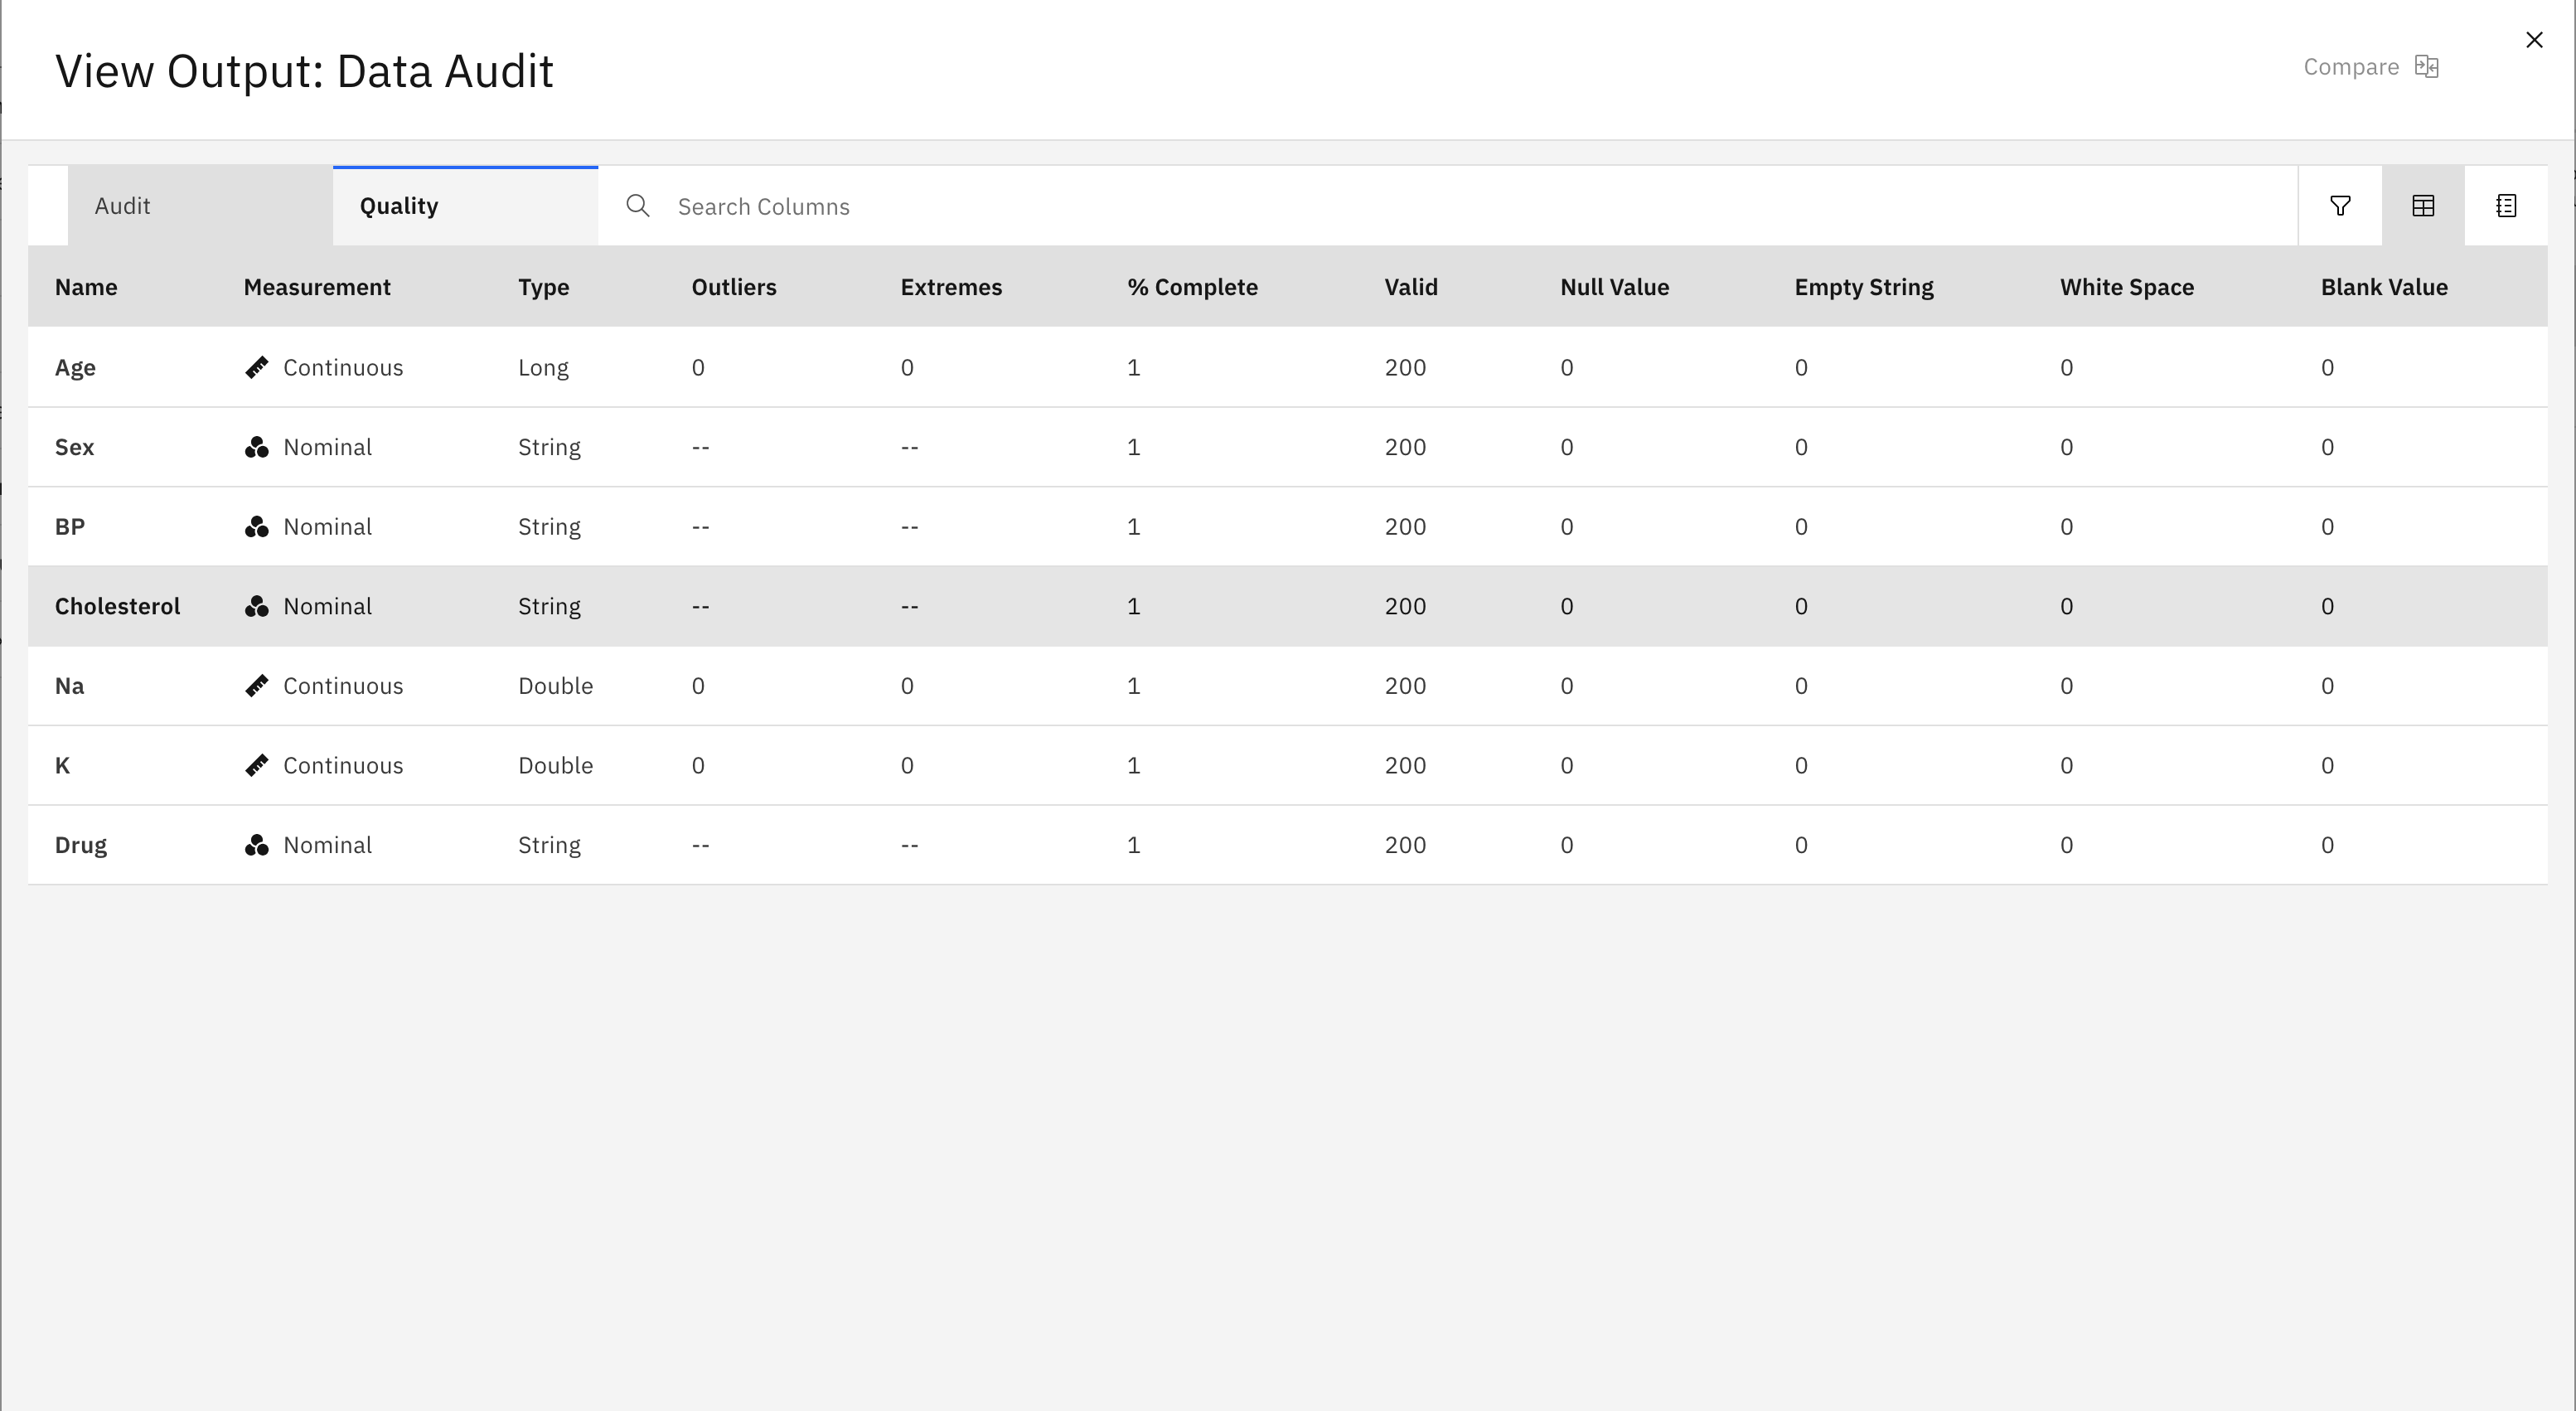
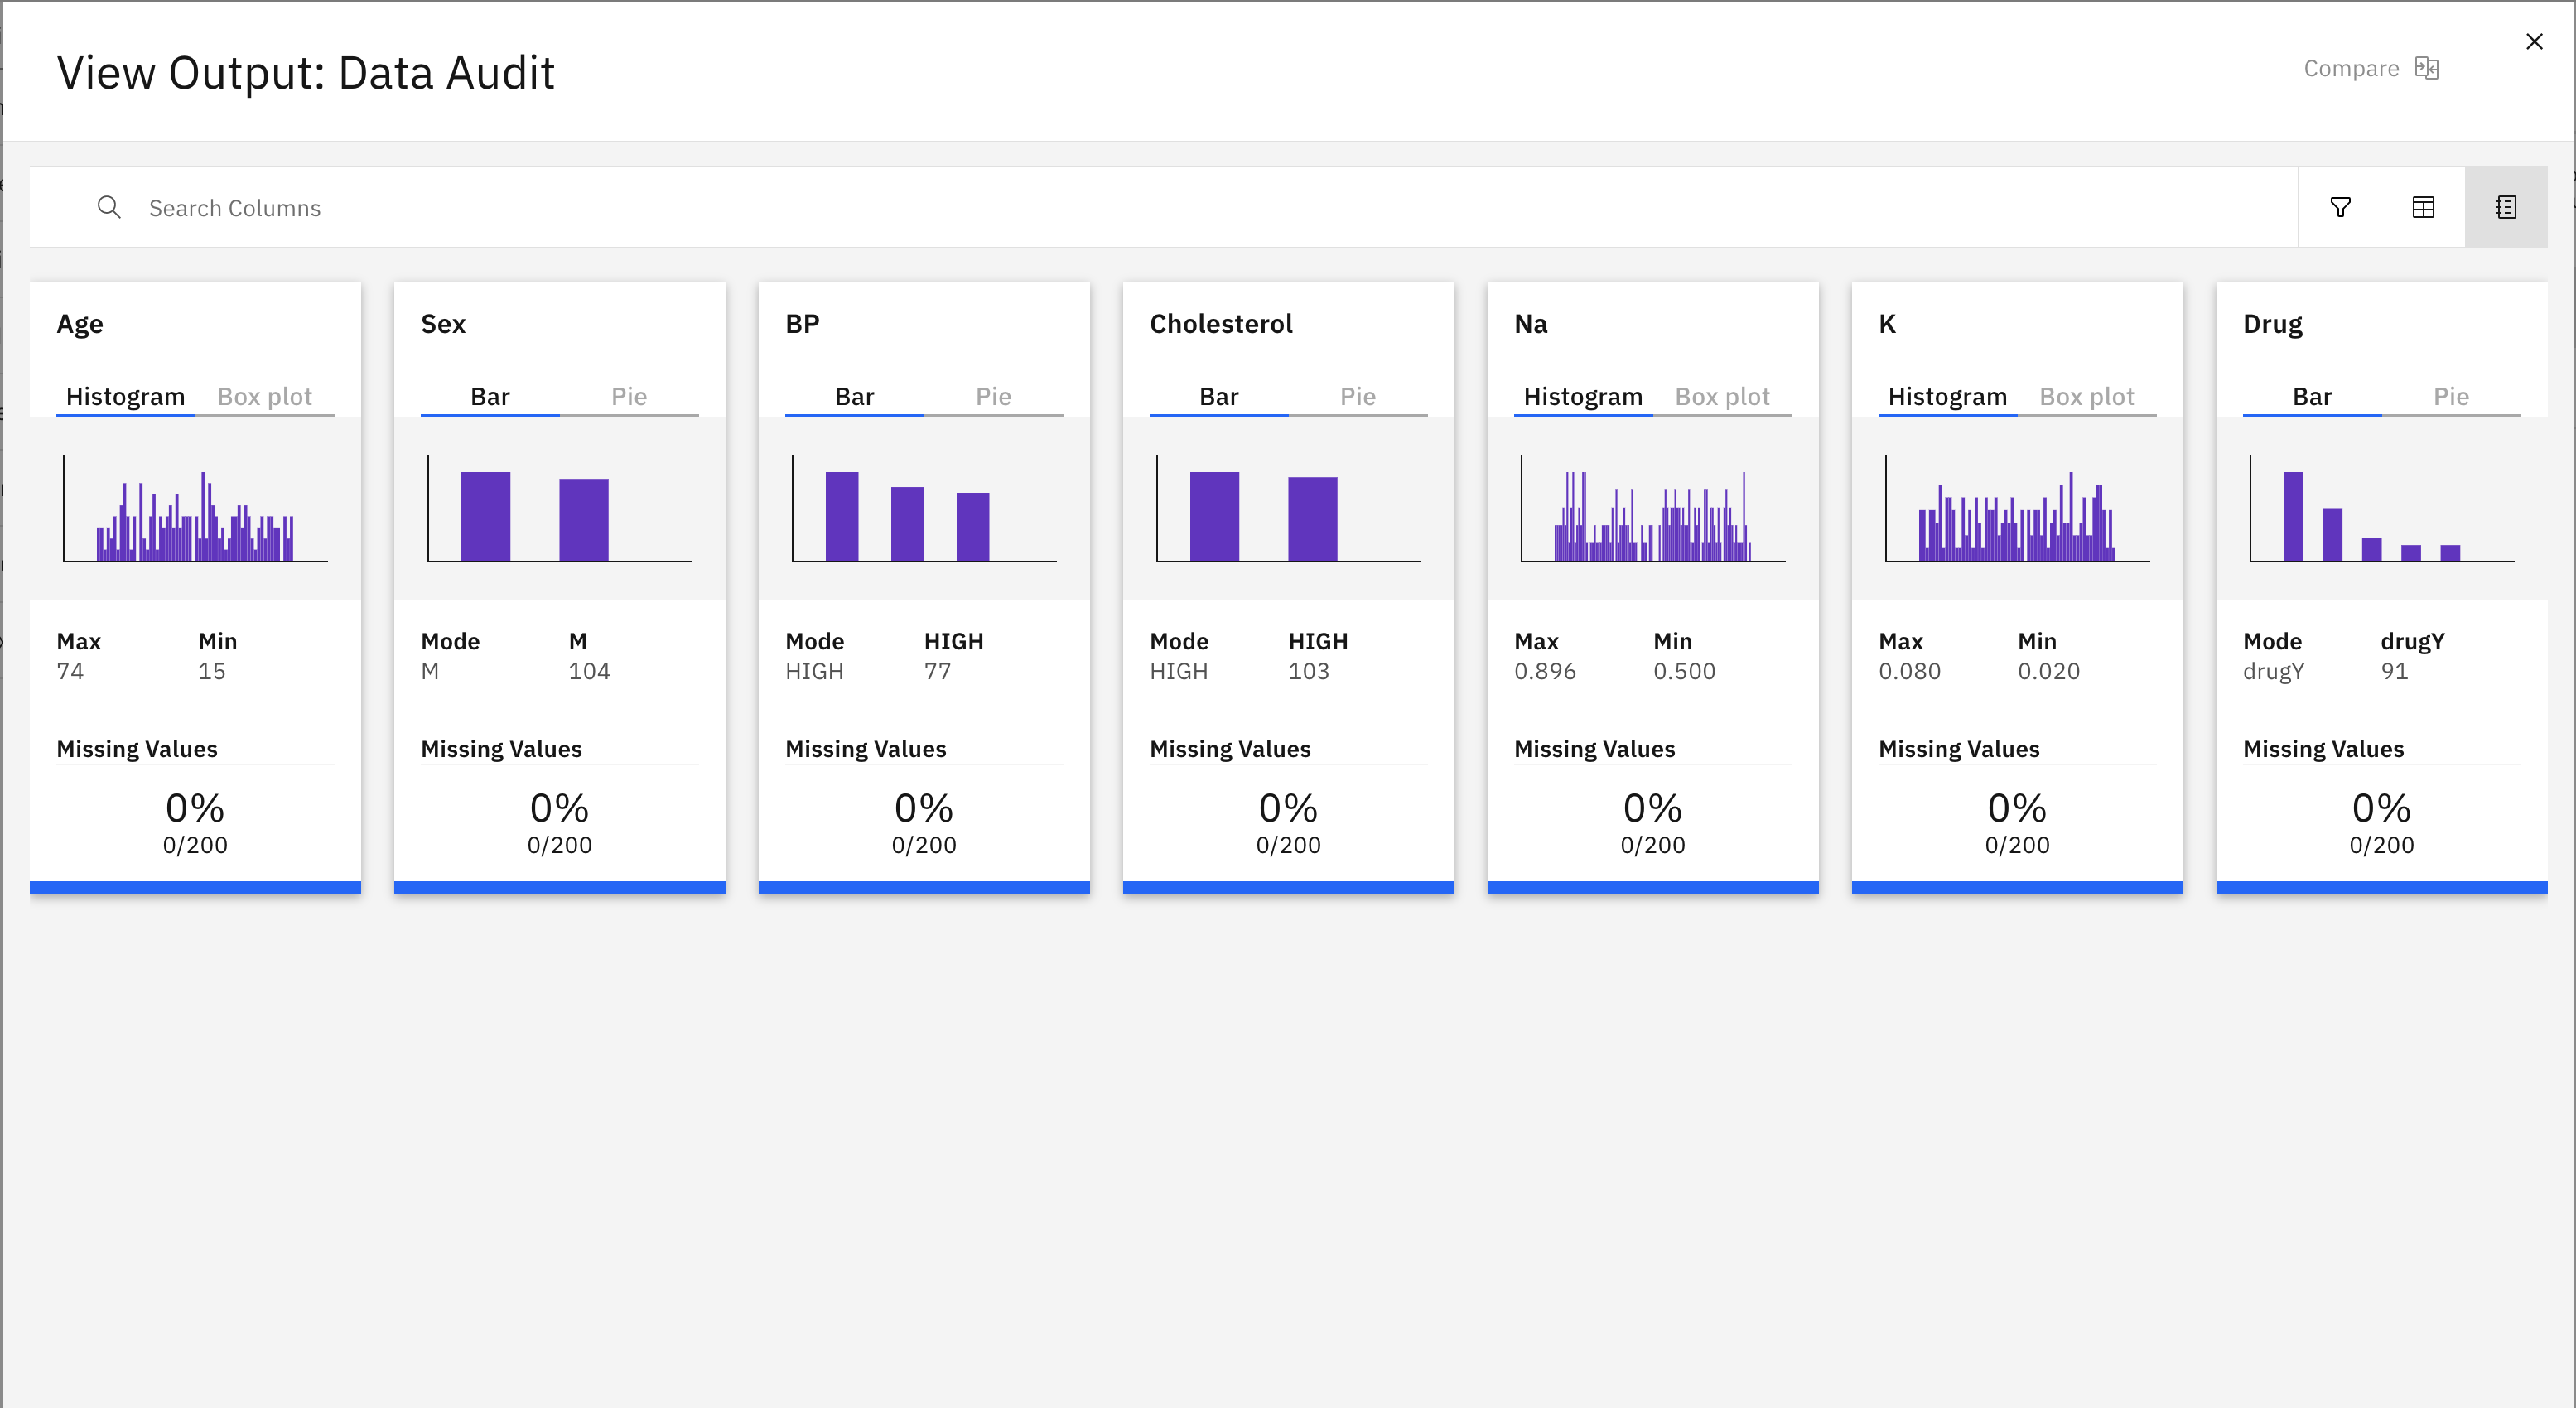
When you run a Data Audit node, interactive output is generated that includes the following information:
- Information such as summary statistics, histograms, box plots, bar charts, pie charts, and more that can be useful in gaining a preliminary understanding of the data.
- Information about outliers, extremes, and missing values.
Using the Data Audit node
The Data Audit node can be attached directly to an Import node or downstream from an instantiated Type node.
Screening or sampling the data. Because an initial audit is effective when dealing with big data, you might use a Sample node to reduce processing time during the initial exploration by selecting only a subset of records. The Data Audit node can also be used with nodes such as Feature Selection and Anomaly Detection in the exploratory stages of analysis.
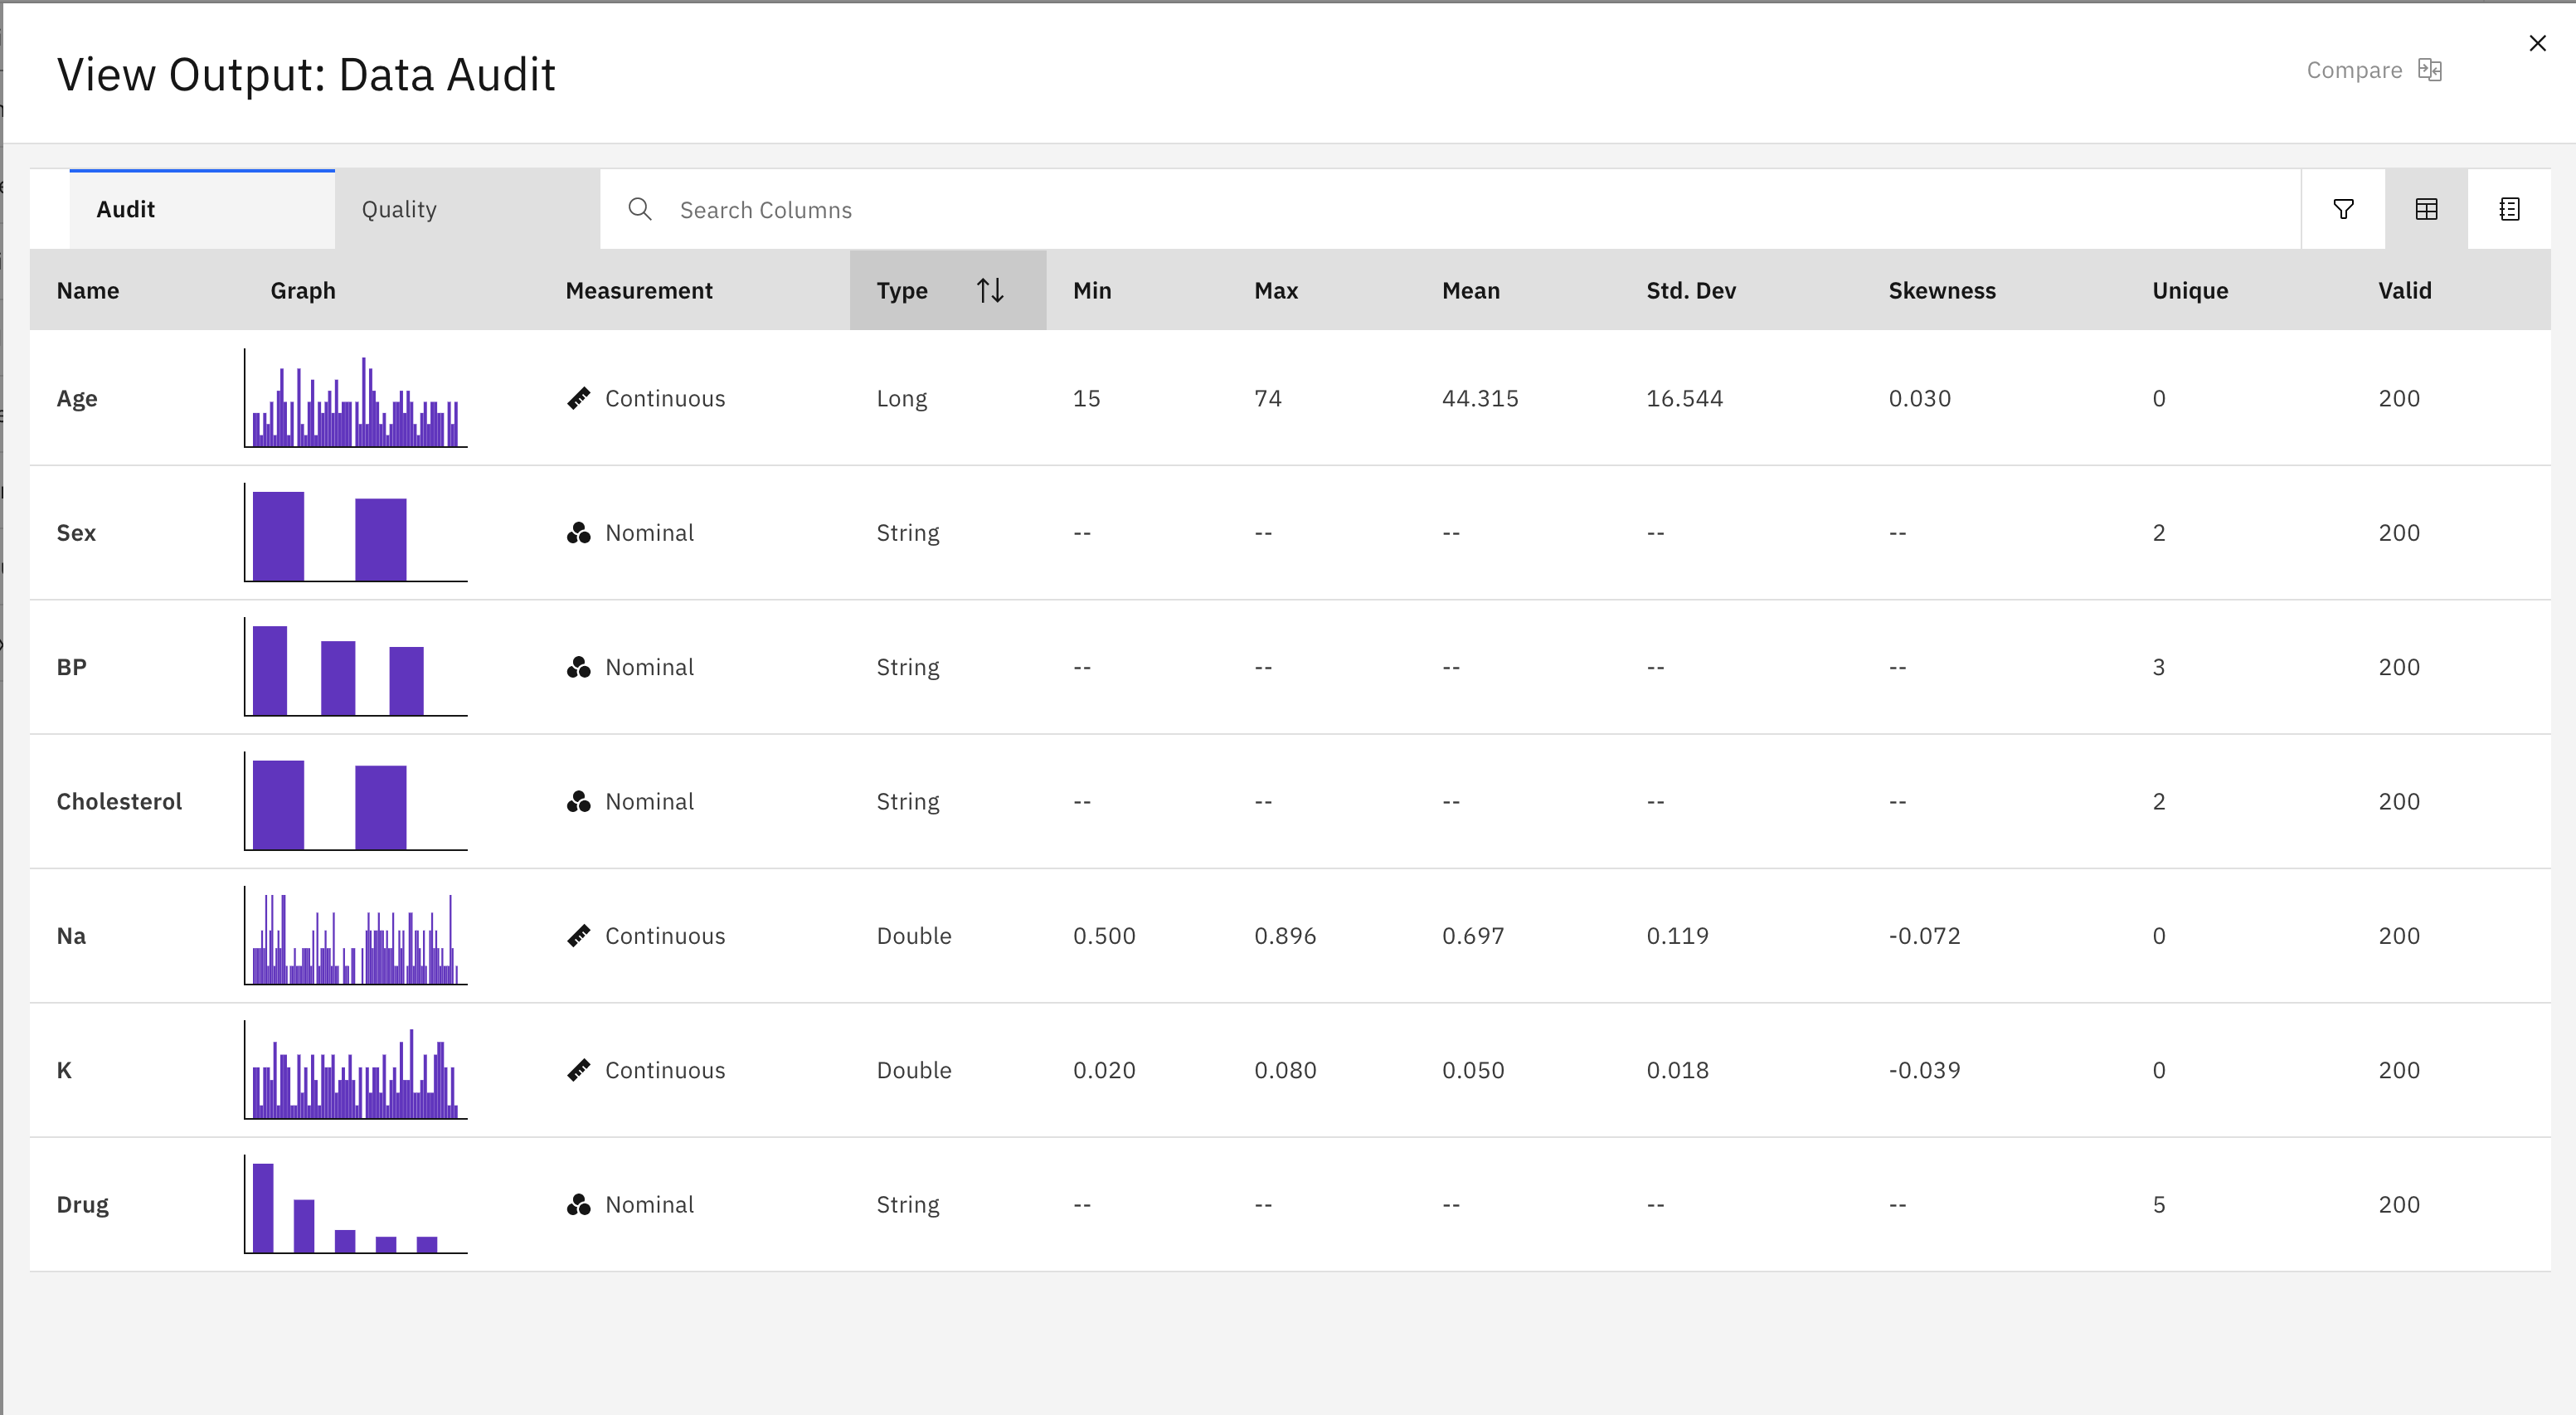
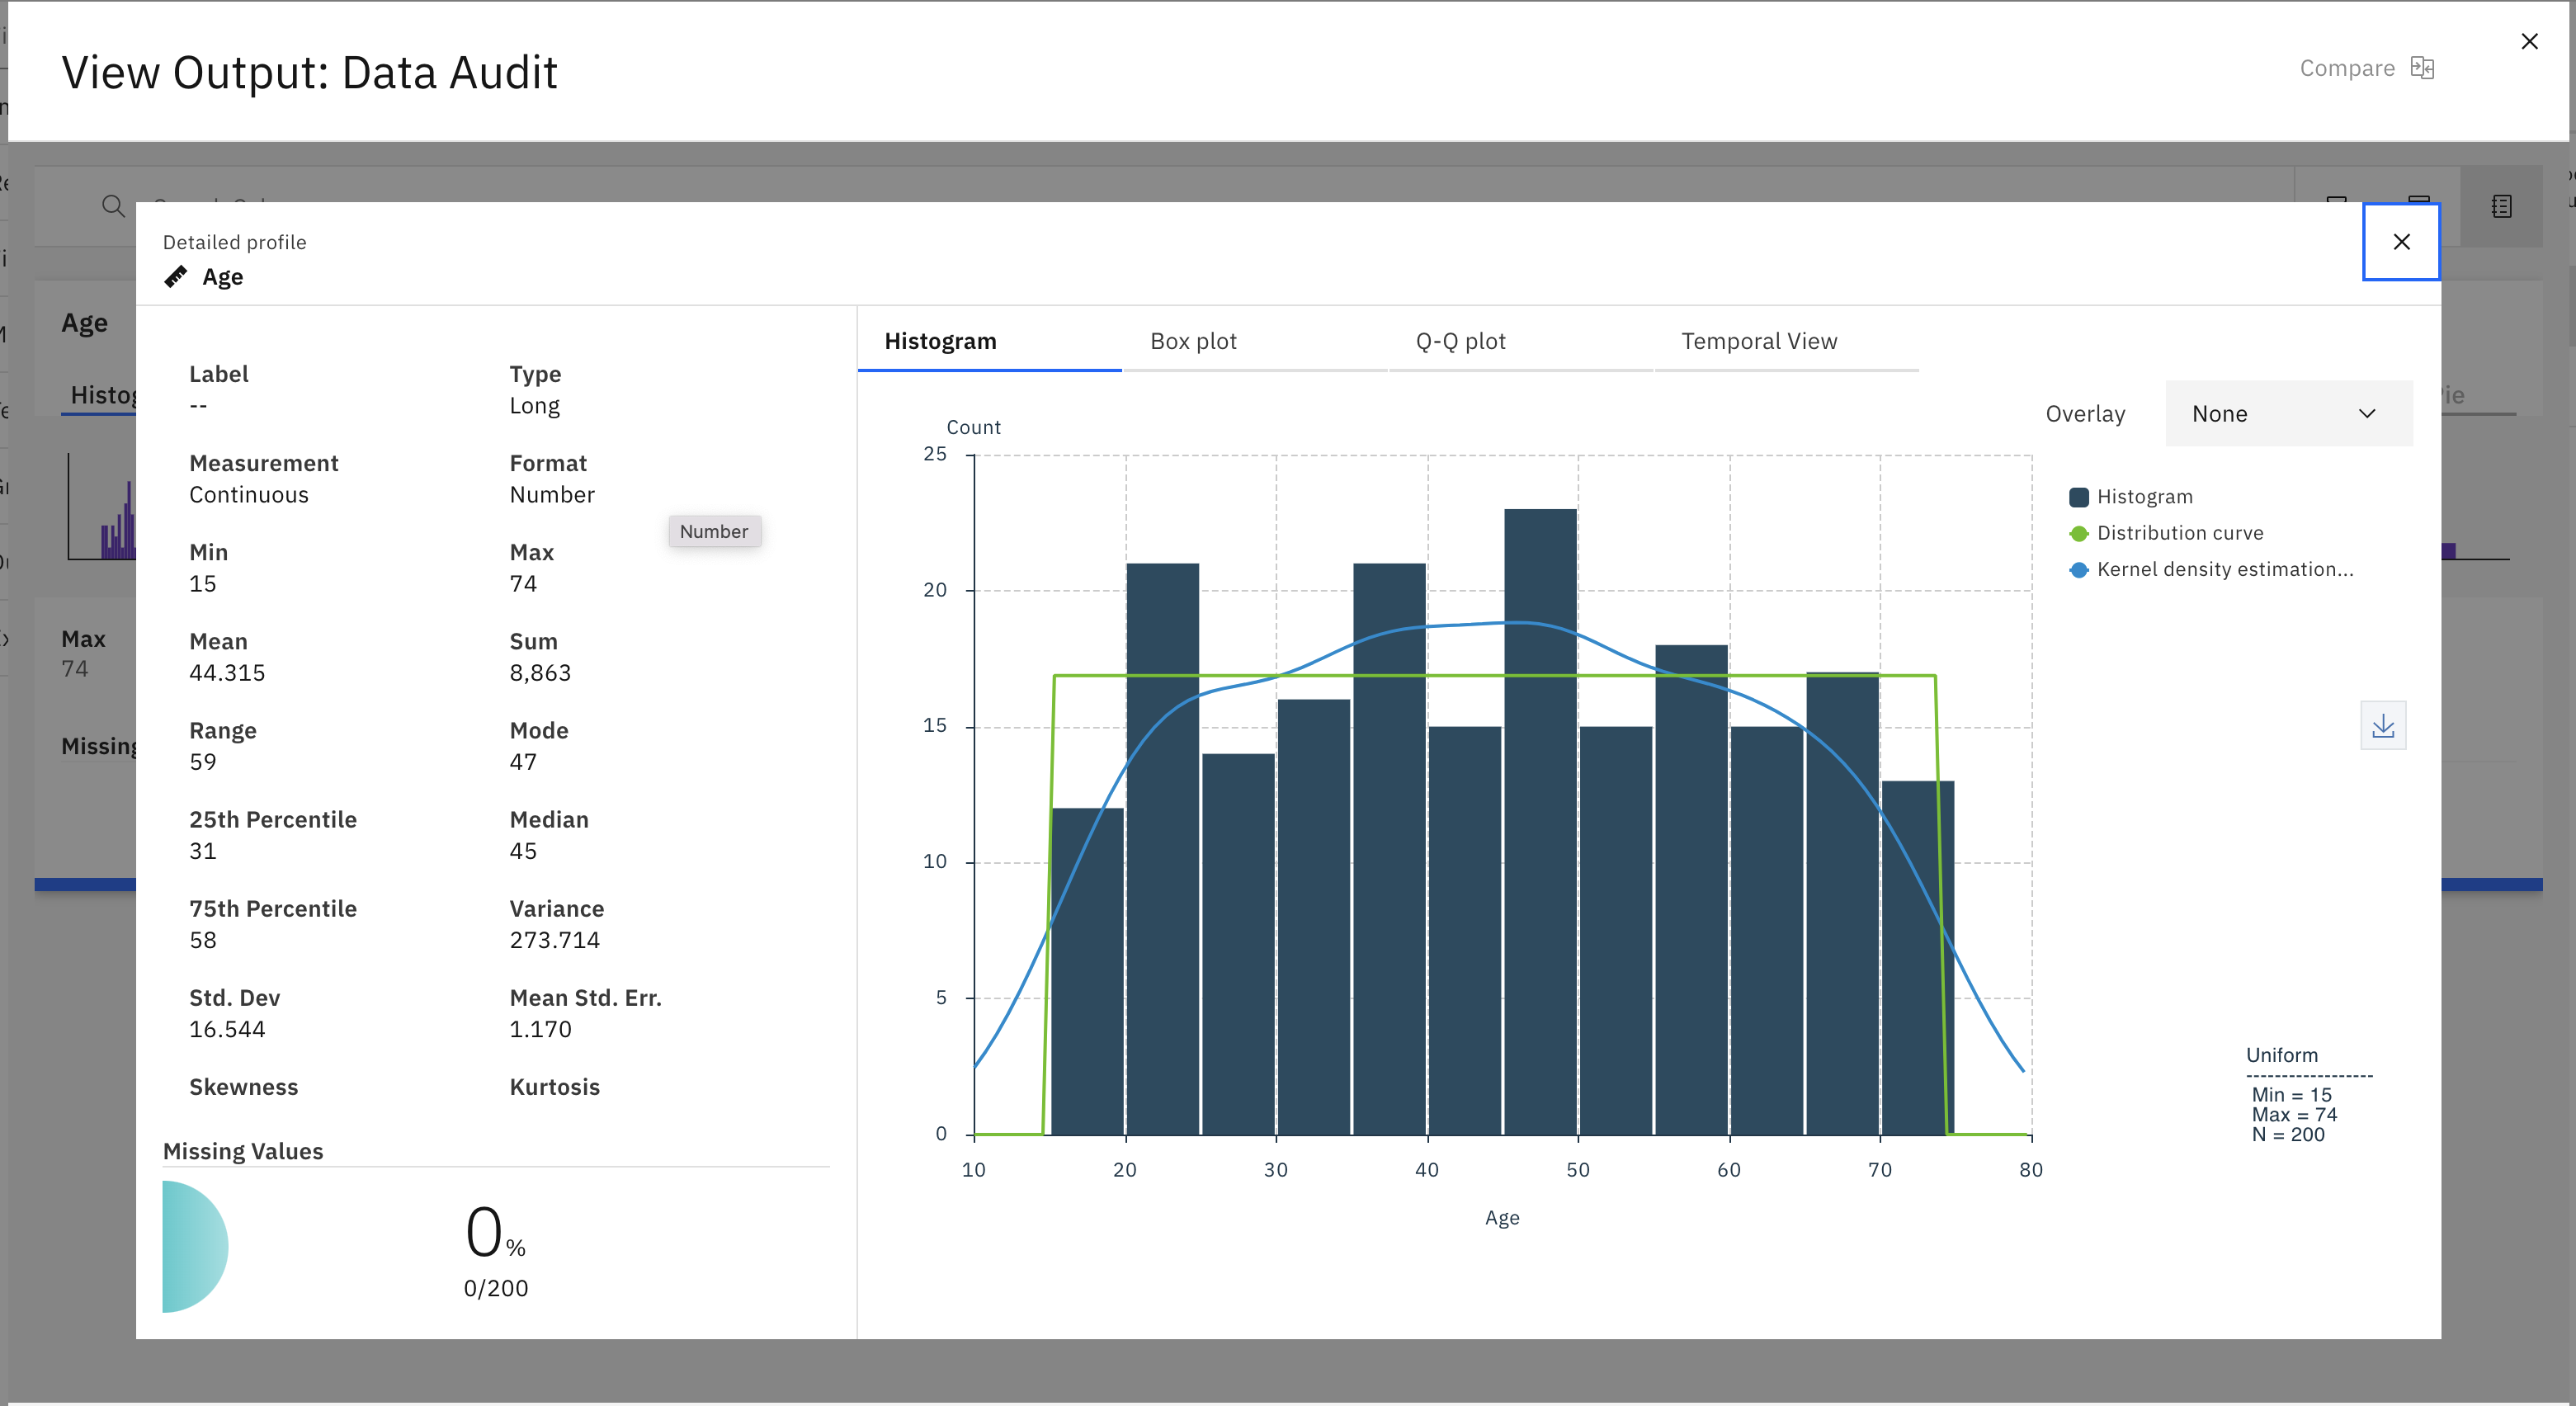
Note: SPSS Modeler displays the traditional
skewness value by default. If you click the graph for more detailed statistics and analysis, both
the adjusted skewness value and the traditional skewness value are displayed.
- Adjusted Skewness
- The adjusted skewness value is calculated by Data View.
- Traditional Skewness
- The adjusted skewness value is calculated by SPSS Modeler and Python.
Was the topic helpful?
0/1000