About cookies on this site Our websites require some cookies to function properly (required). In addition, other cookies may be used with your consent to analyze site usage, improve the user experience and for advertising. For more information, please review your options. By visiting our website, you agree to our processing of information as described in IBM’sprivacy statement. To provide a smooth navigation, your cookie preferences will be shared across the IBM web domains listed here.
Last updated: Nov 21, 2024
When you create a new Decision Optimization experiment in your project, the Prepare data view opens.
In this view you can browse and import data sets, including connected data, that you already have in your project. This data is used as input data for the model.
To open the data pane, click the data icon  .
.
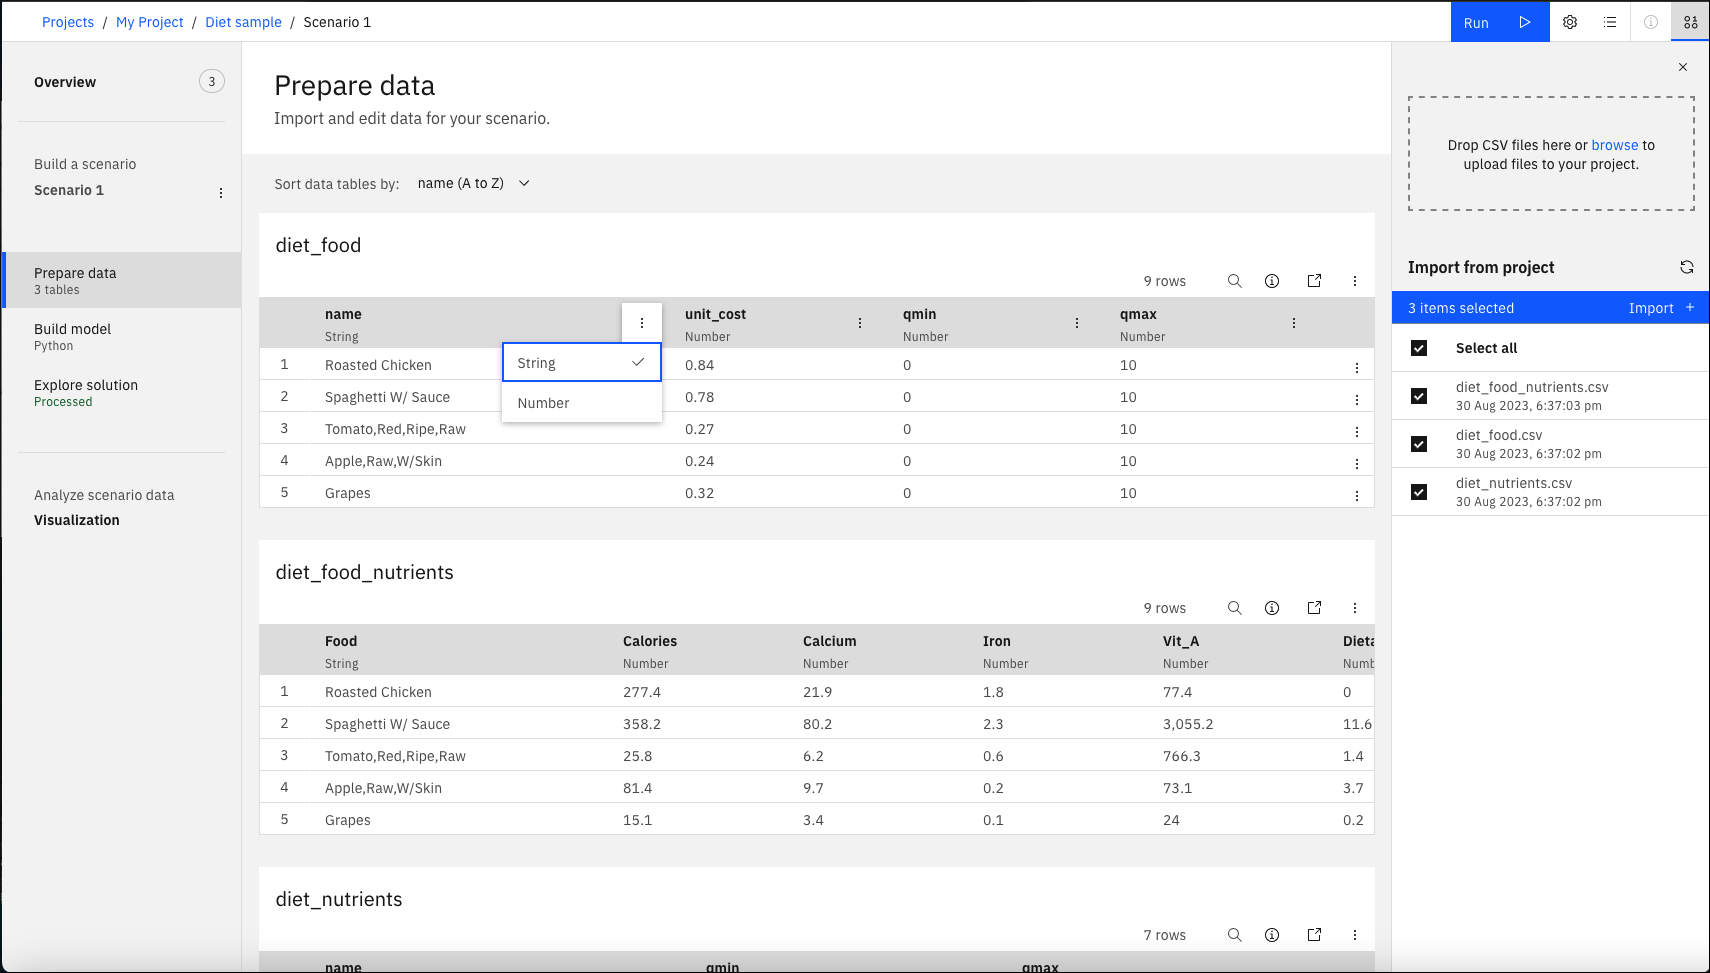
The data that is shown here is taken from the Diet sample. Using this data, this model analyzes the requirements of a healthy diet and the resources available and prescribes the best quantities of different food types.
You can see and edit your input data in this Prepare data view, but you can also visualize your input data by creating tables or charts in the Visualization view.
Learn more
- For more information about scenarios, see Scenarios in a Decision Optimization experiment
- For more information about comparing tables, see Comparing scenario tables in a Decision Optimization experiment.
- For more information about the Visualization view, see the Visualization view in a Decision Optimization experiment.