About cookies on this site Our websites require some cookies to function properly (required). In addition, other cookies may be used with your consent to analyze site usage, improve the user experience and for advertising. For more information, please review your options. By visiting our website, you agree to our processing of information as described in IBM’sprivacy statement. To provide a smooth navigation, your cookie preferences will be shared across the IBM web domains listed here.
Last updated: Nov 21, 2024
This example shows you how to create and solve a Python-based model by using a sample.
Before you begin
- Requirements
- To edit and run Decision
Optimization models, you must have the following prerequisites:
- Admin or Editor roles
- You must have Admin or Editor roles in the project. Viewers of shared projects can only see experiments, but cannot modify or run them
- watsonx.ai Runtime service
- You must have a watsonx.ai Runtime service that is associated with your project. You can add one when you create a Decision Optimization experiment.
- Deployment space
- You must have a deployment space that is associated with your Decision Optimization experiment. You can choose a deployment space when you create a Decision Optimization experiment.
About this task
This well-known optimization problem identifies the best mix of foodstuffs to meet dietary requirements while minimizing costs. The data inputs are the nutritional profile and price of different foods and the min and max values for nutrients in a diet. The model is expressed as the minimization of a linear program. The files that are used in this sample are available in the DO-samples.
Procedure
To create and solve a Python-based model by using a sample:
-
In the Prepare data
view, you can see the data assets
imported.
These tables represent the min and max values for nutrients in the diet (
diet_nutrientsdiet_food_nutrientsdiet_food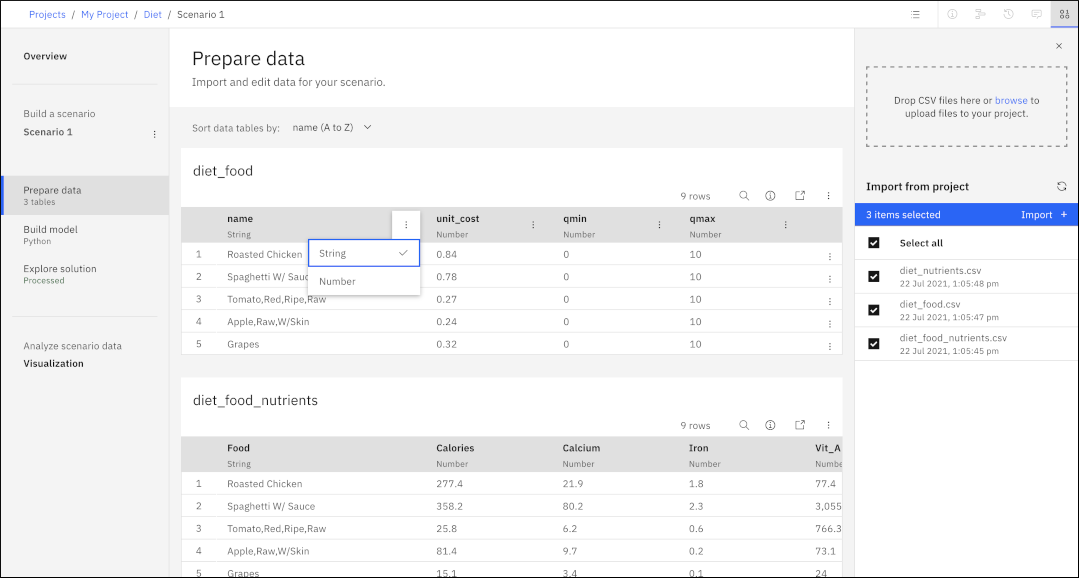
-
Click Build model in the
sidebar to view your model.
The Python model minimizes the cost of the food in the diet while satisfying minimum nutrient and calorie requirements.
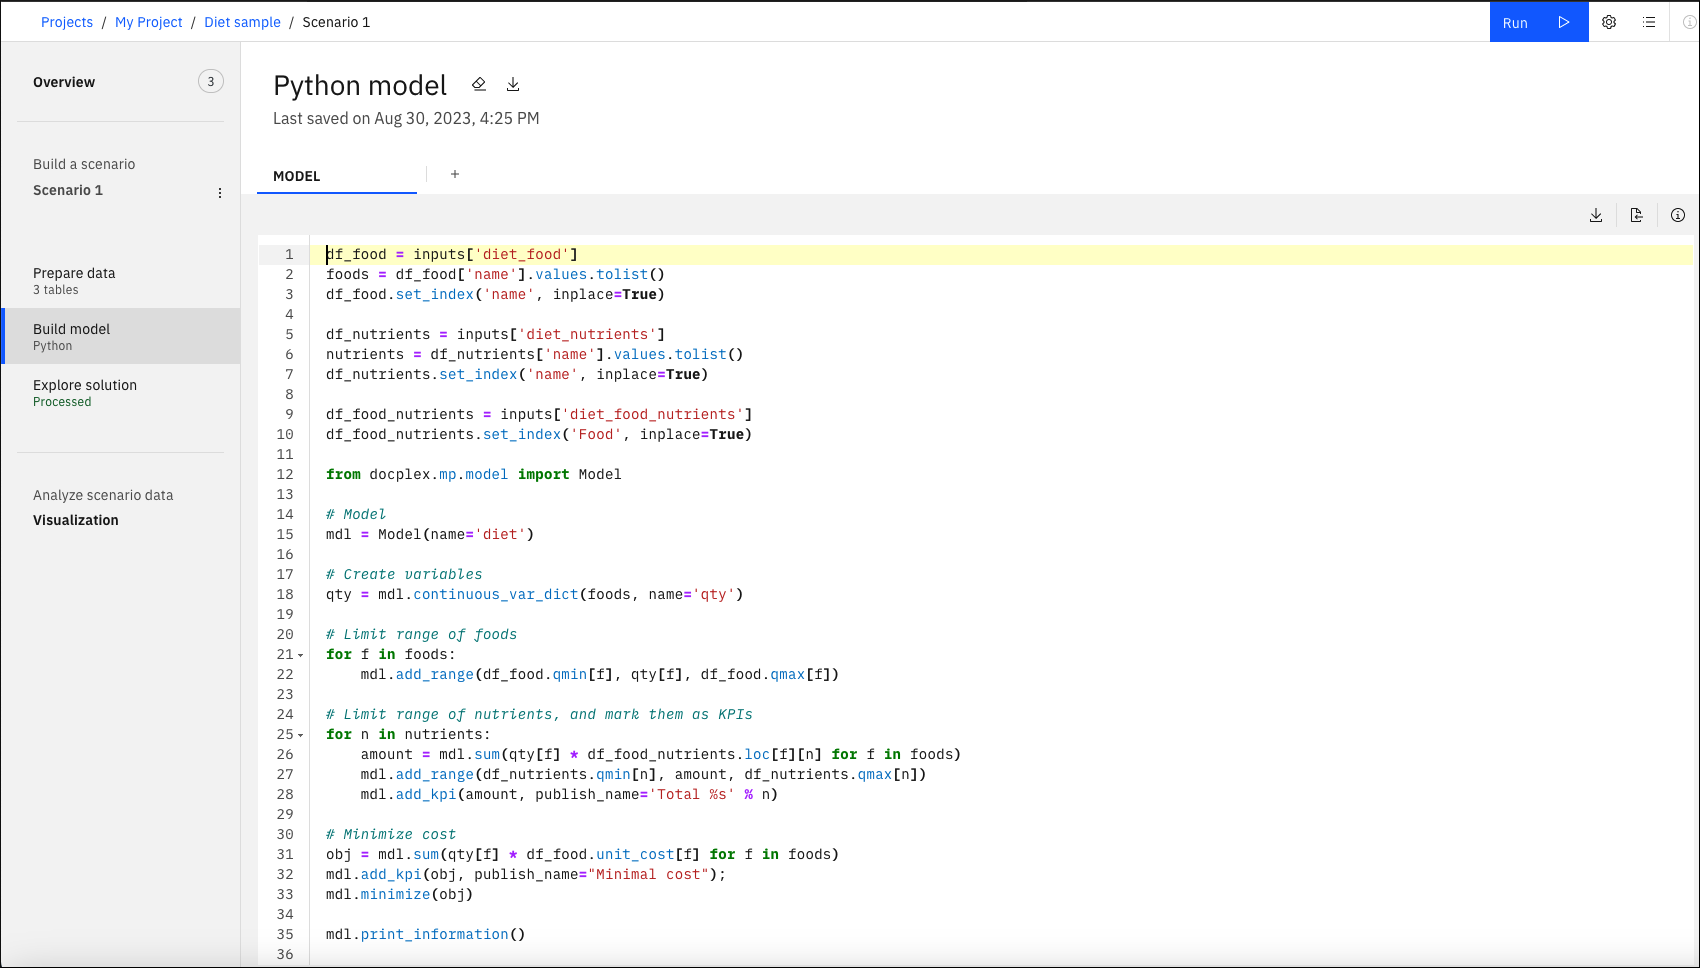
Note also how the inputs (tables in the Prepare data view) and the outputs (in this case the solution table to be displayed in the Explore solution view) are specified in this model.
Results
When the run is completed, you can see the results in the Explore solution view. You can also click Engine statistics or Log to see the solution chart and inspect the log files. The first tab in the Explore solution view shows the objective (or objectives if you have several) with its values and weights. The Solution tables tab provides you with a list of foods and their quantities, along with the nutrients that they provide.
You can also download the solution tables as csv
If your model had any conflicting constraints, these would be shown in the Conflicts tab with the Relaxations necessary to solve the model.
In the Visualization view, the solution is displayed as a table and a chart in the Solution page. You can add notes, different types of tables and charts to show input data, solution data or KPIs by selecting and editing the widgets. You can also create different pages in the Visualization view. For example, an Input page is also provided in this sample. For more information, see Visualization view in a Decision Optimization experiment.
You're ready to start running comparisons between different scenarios. For example, the basic solution contains a quantity of hot dog. You might want to check an alternate solution for someone who prefers a vegetarian diet.